Why I made Sourdough, a new vector tile schema for OpenStreetMap
This blog post is adapted from a talk I gave about Sourdough at the CUGOS Fall Fling on November 14, 2025. If you’d rather watch it you can view the recording on YouTube
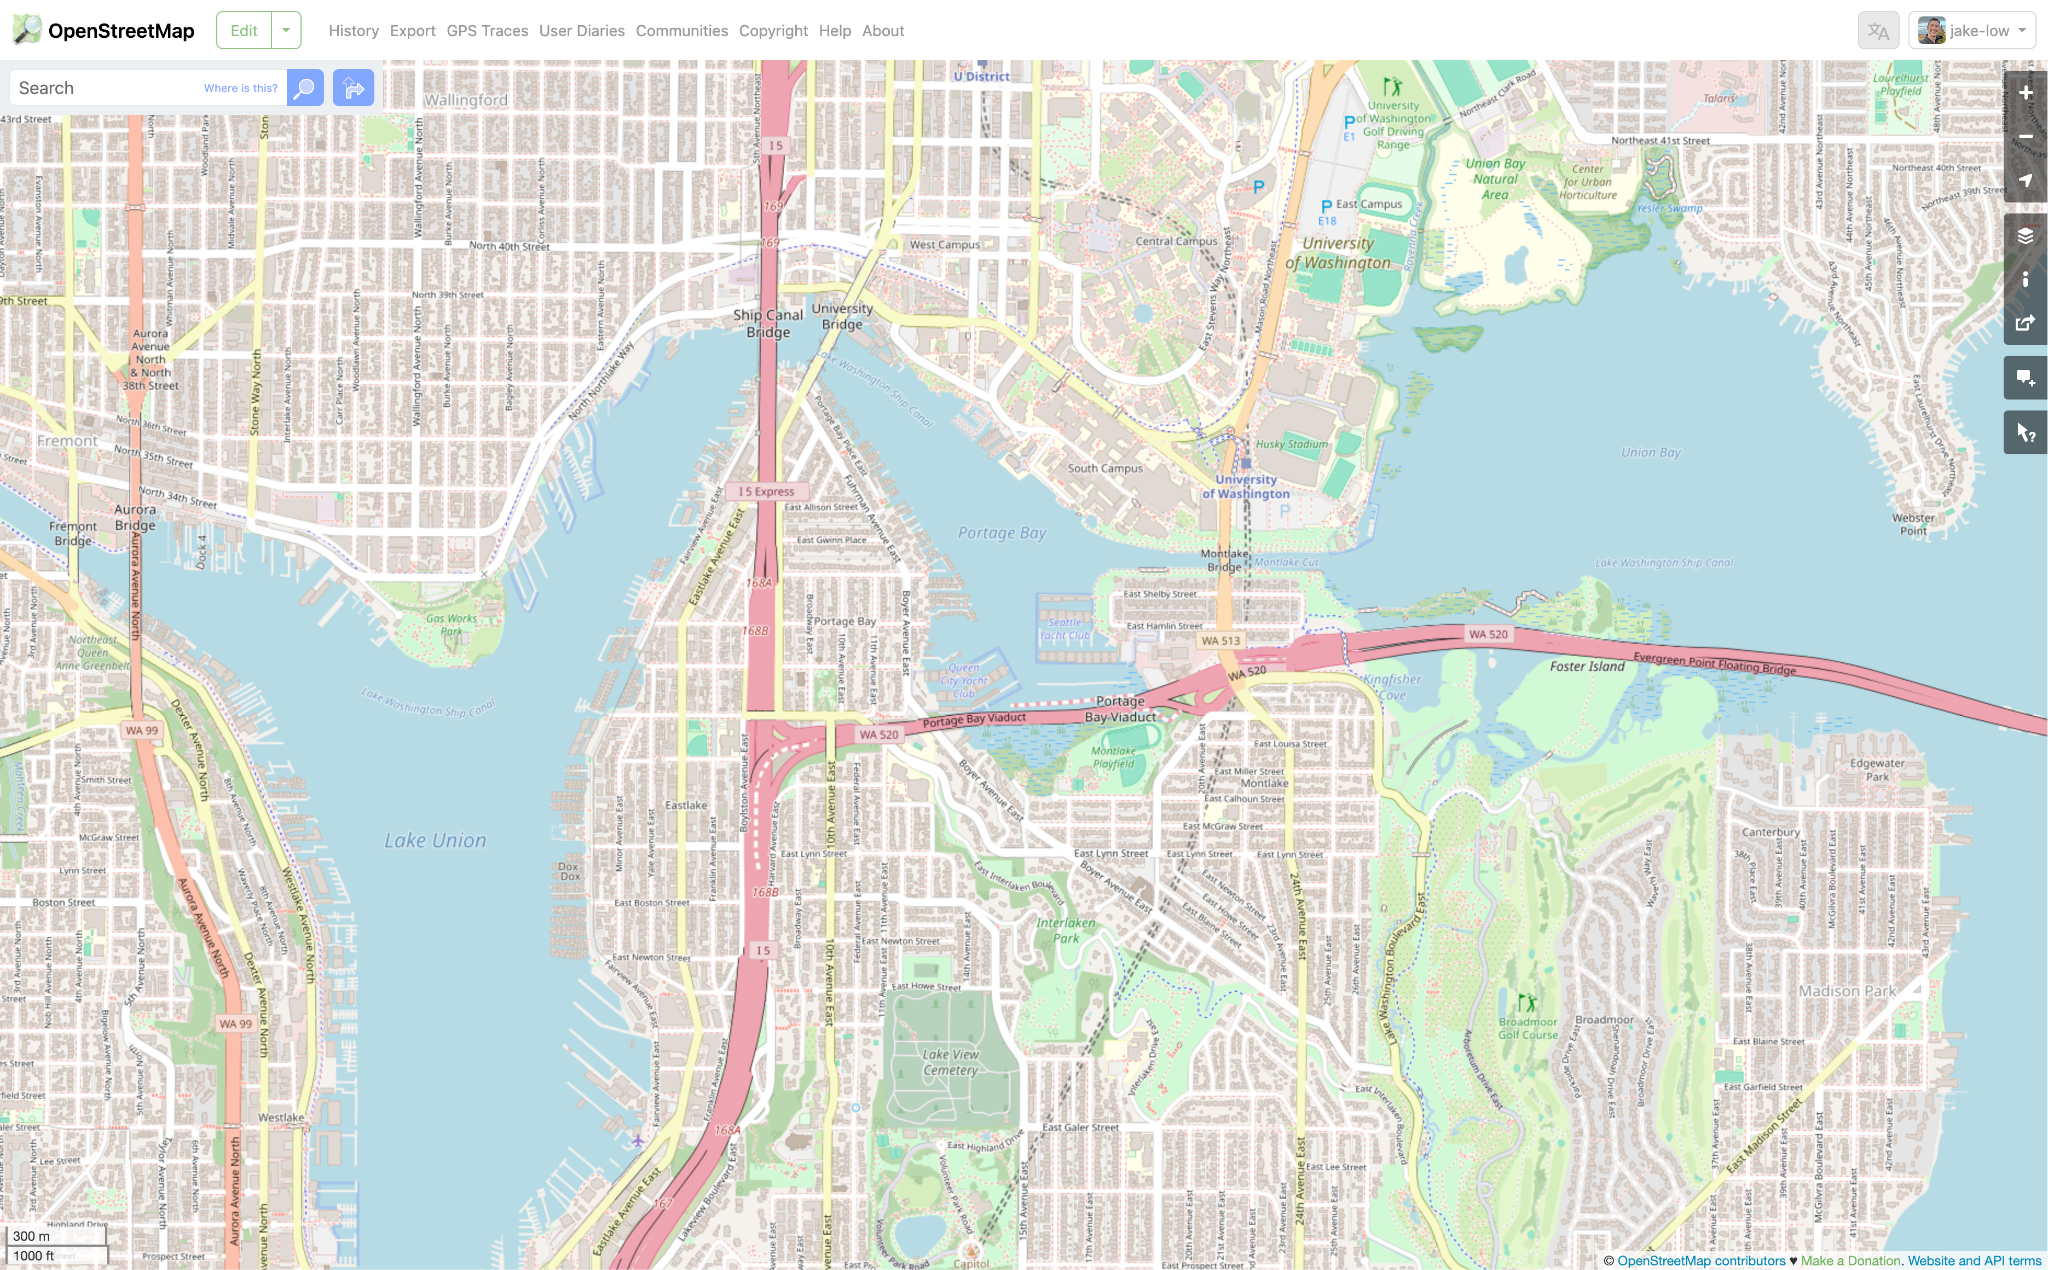
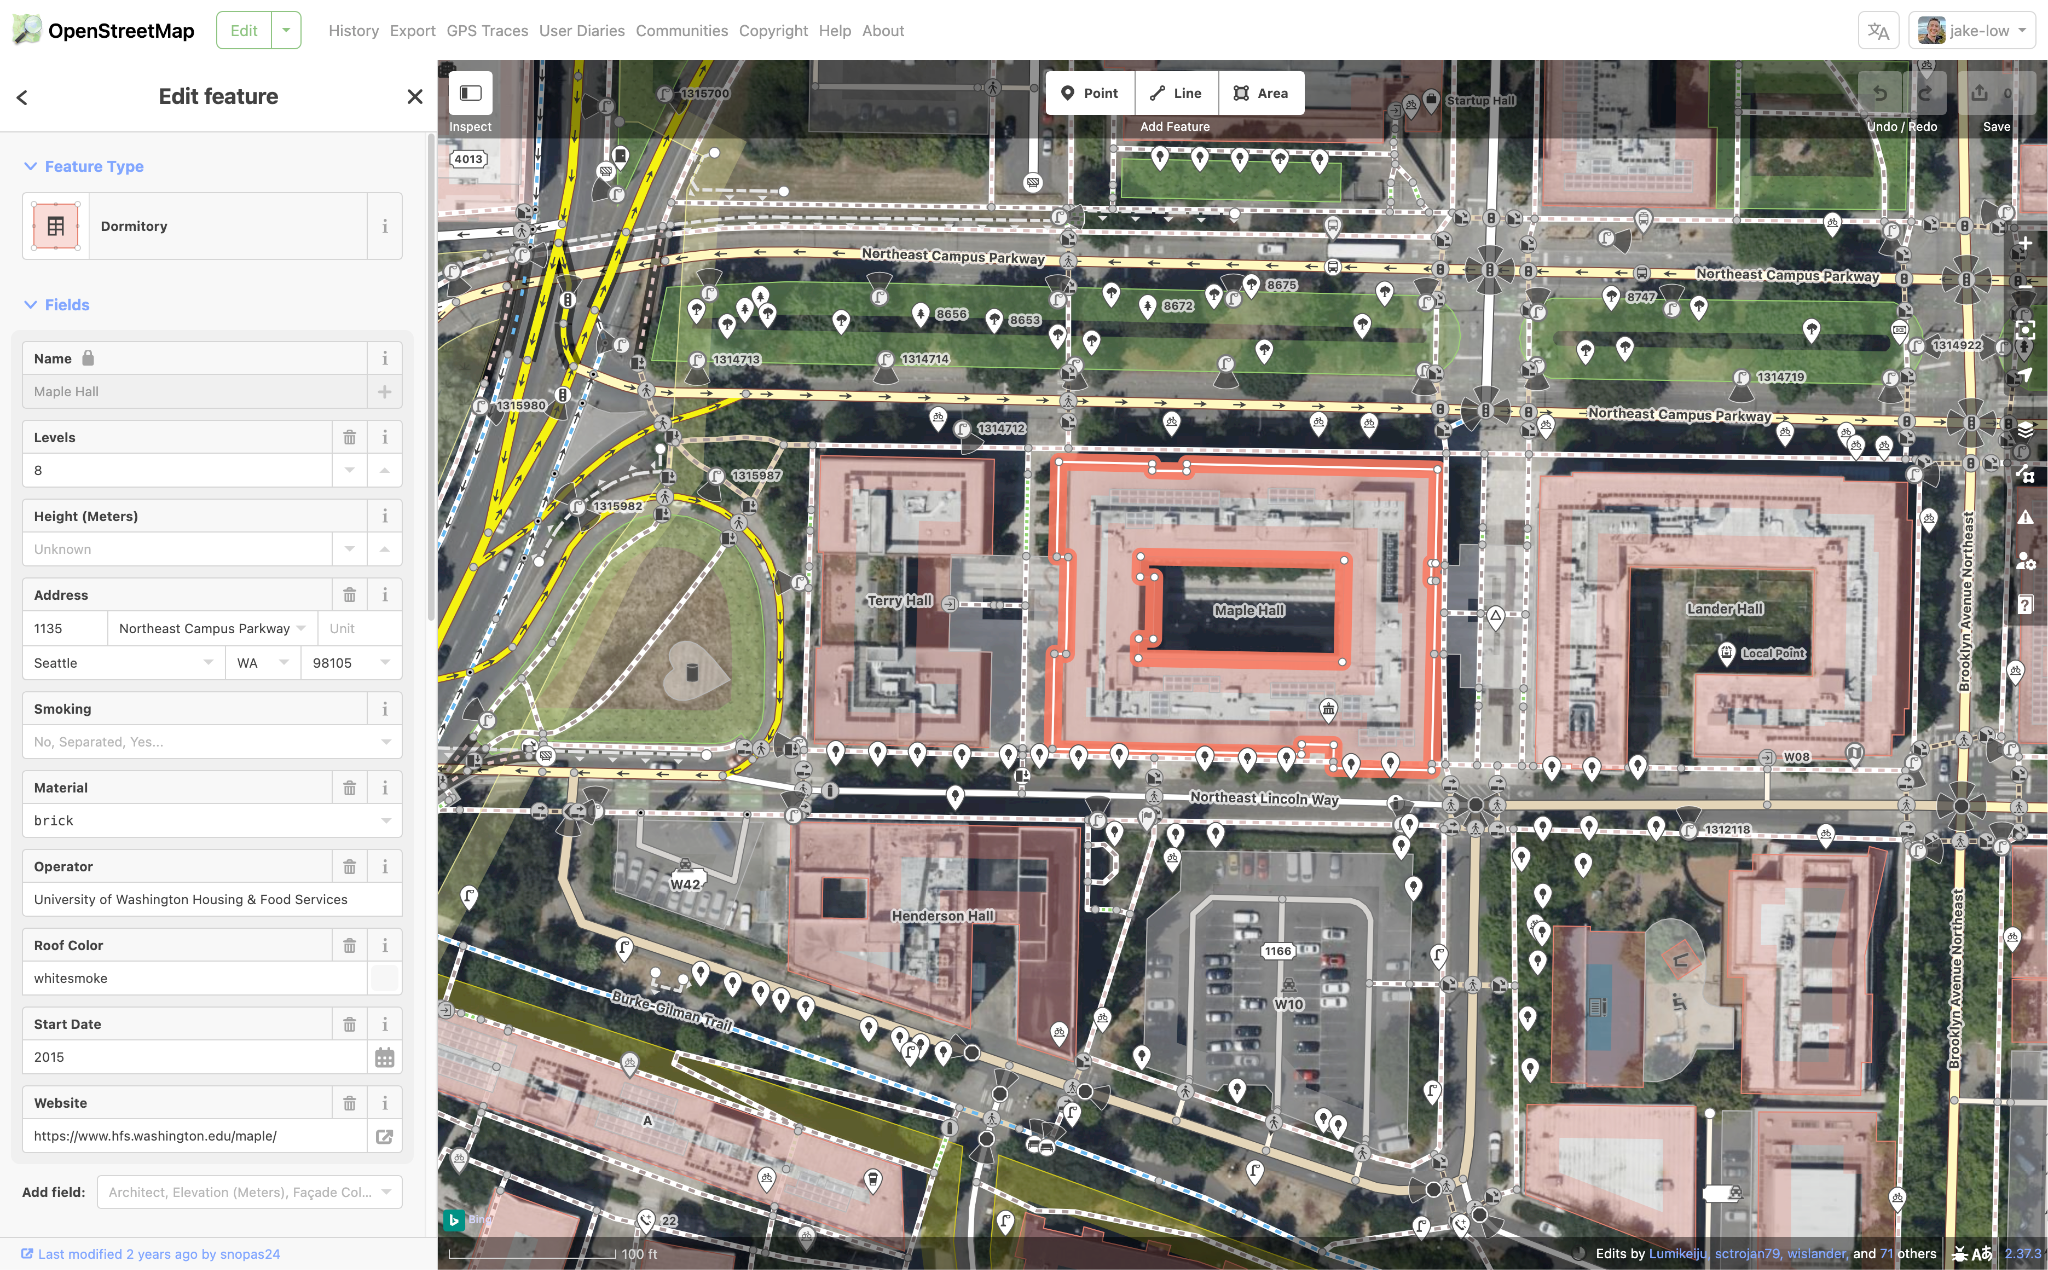
In case you aren’t familiar, OpenStreetMap is a free map of the world that anyone can edit. It’s a lot like if Wikipedia were a map. If you go to openstreetmap.org you can view the map, search for places, get directions, etc. But unlike Google Maps or other commercial options, you can also click the “Edit” button at the top of the screen and modify the map, to add things that are missing or fix things that are wrong. You can edit the shapes of things like roads and buildings (using satellite imagery for reference) and can also add metadata like the name of a building or the speed limit on a road. When you click “Save”, your edits are published for everyone in the world.
There are two things about OpenStreetMap that are important to know. The first is that OpenStreetMap isn’t just a map. Under the surface, OpenStreetMap is really a free geospatial dataset of stuff that exists in the world. You can download this data for free and use it for any purpose: make your own maps, put it in commercial software, use it for research or scientific analysis, make art, whatever you want.
The second is that OpenStreetMap has more than just streets and buildings and whatnot that you’d expect to see on typical maps. It tries to catalog everything that physically exists in the world at a fixed location. You can add fire hydrants, cell towers, power lines, Little Free Libraries, ballot drop boxes, surveillance cameras, and pretty much anything else you can think of to OpenStreetMap. Most maps don’t display these things, but OpenStreetMap volunteers are finding them and adding them to the dataset, so they are available for anyone that wants to use this data.
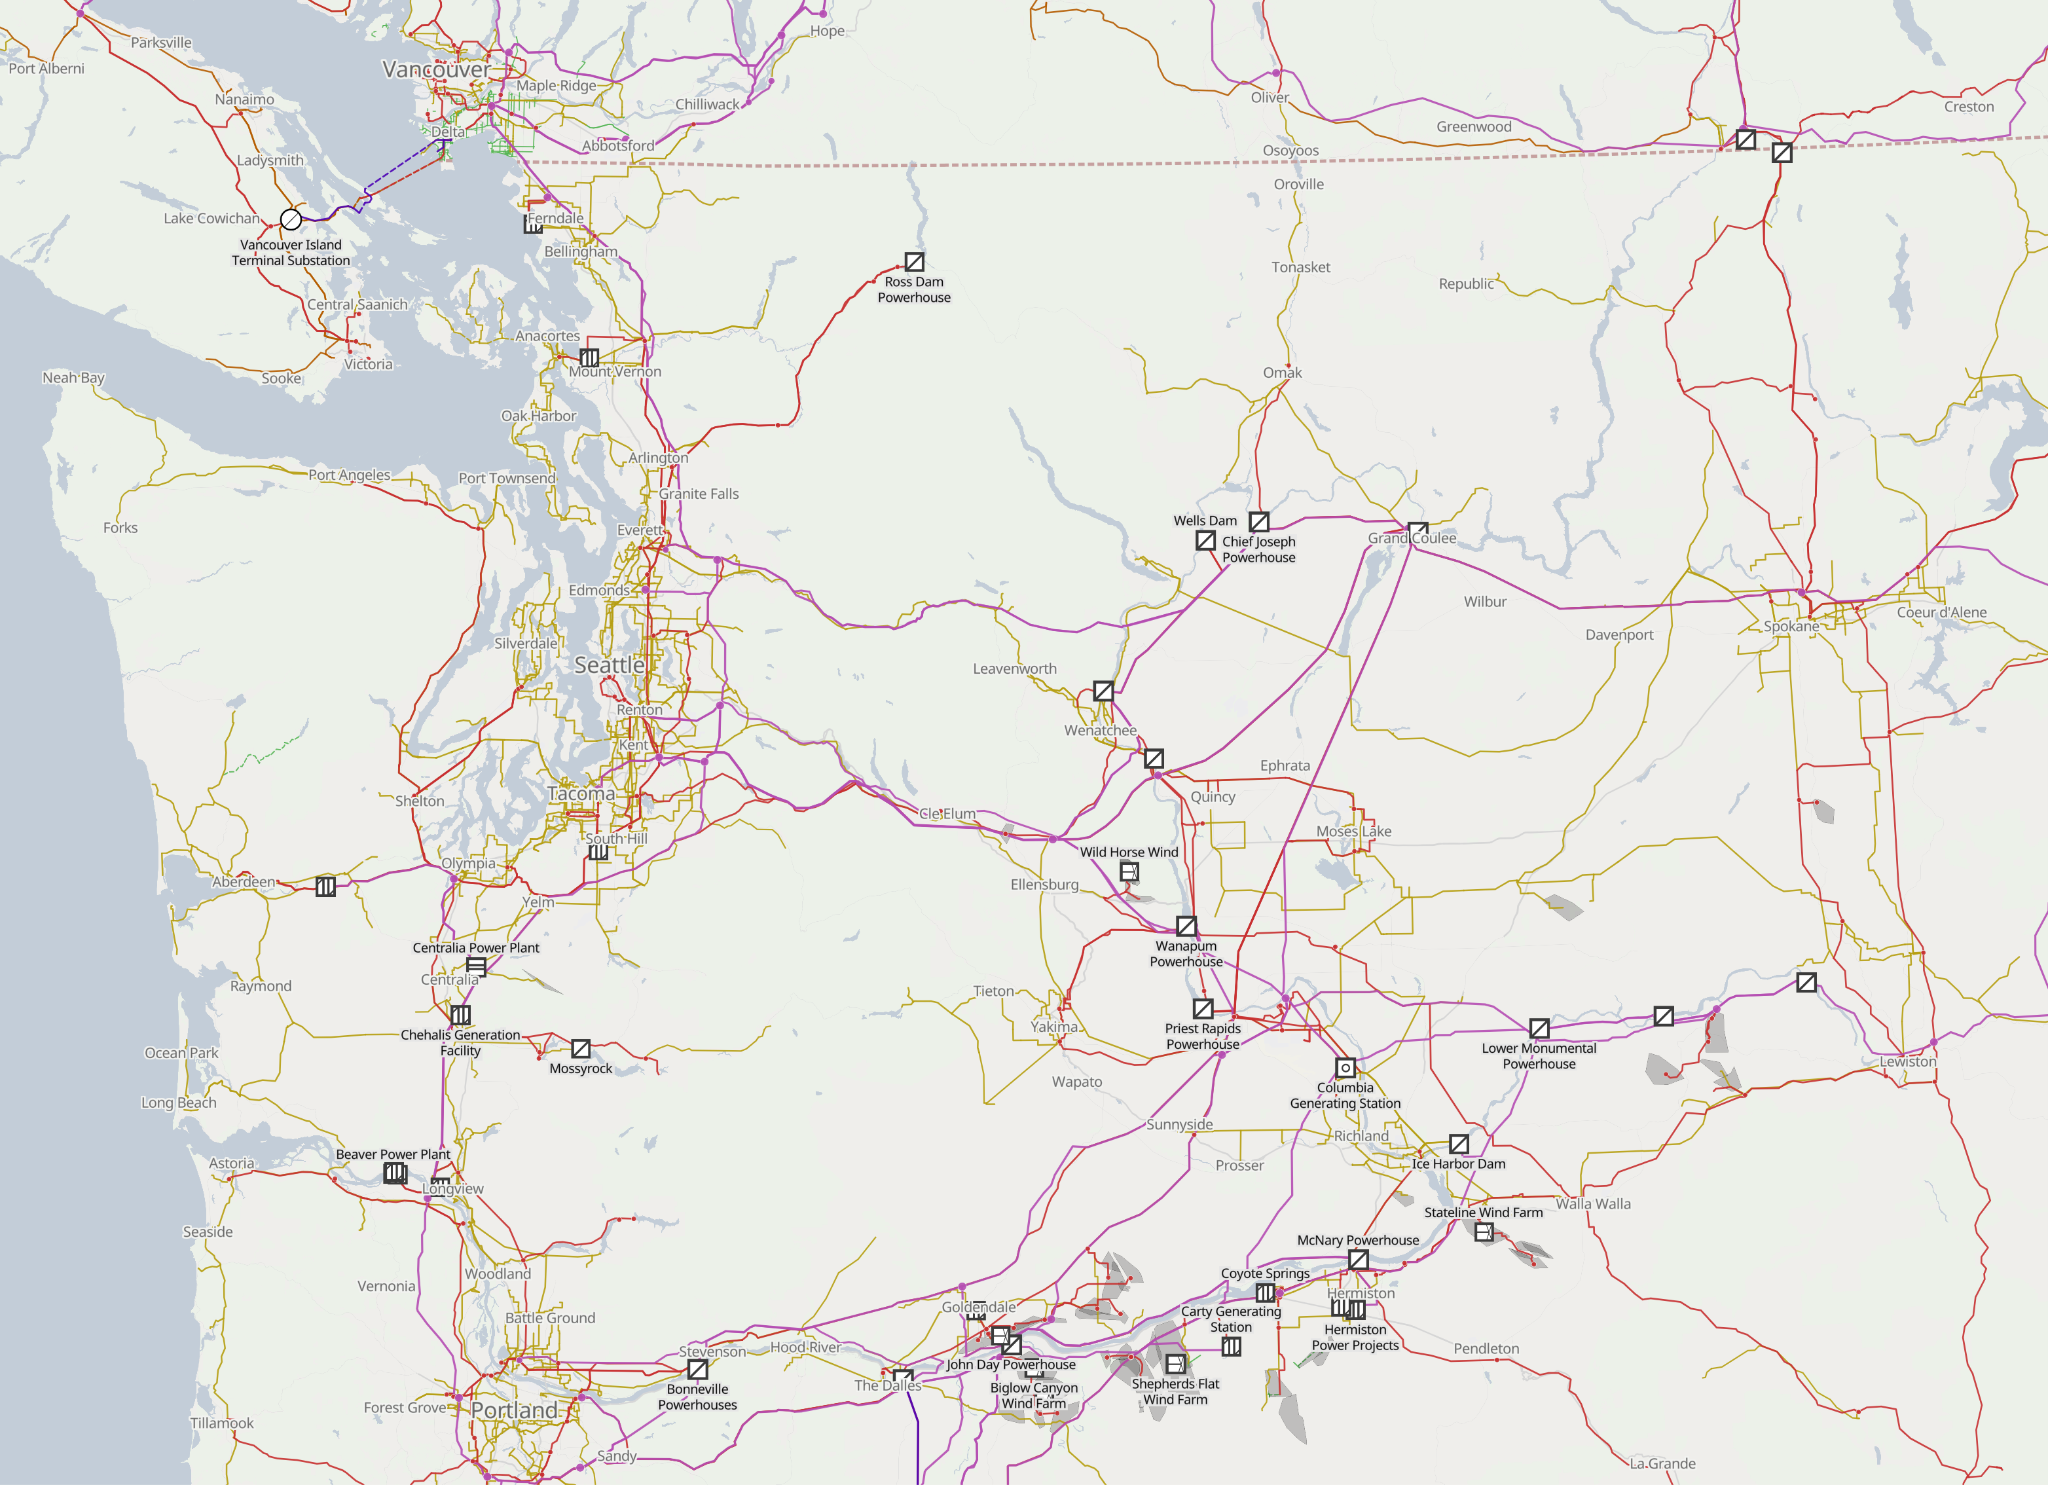
Because of these two facts, it’s possible to make some really interesting maps with OpenStreetMap data—maps that show aspects of the world you don’t see every day. A great example is OpenInfraMap, which shows power infrastructure. It color-codes power lines by their voltage and labels power stations along with their output in megawatts. All of this data comes from OpenStreetMap; most maps wouldn’t display this info, but it’s there waiting to be used if you want it.
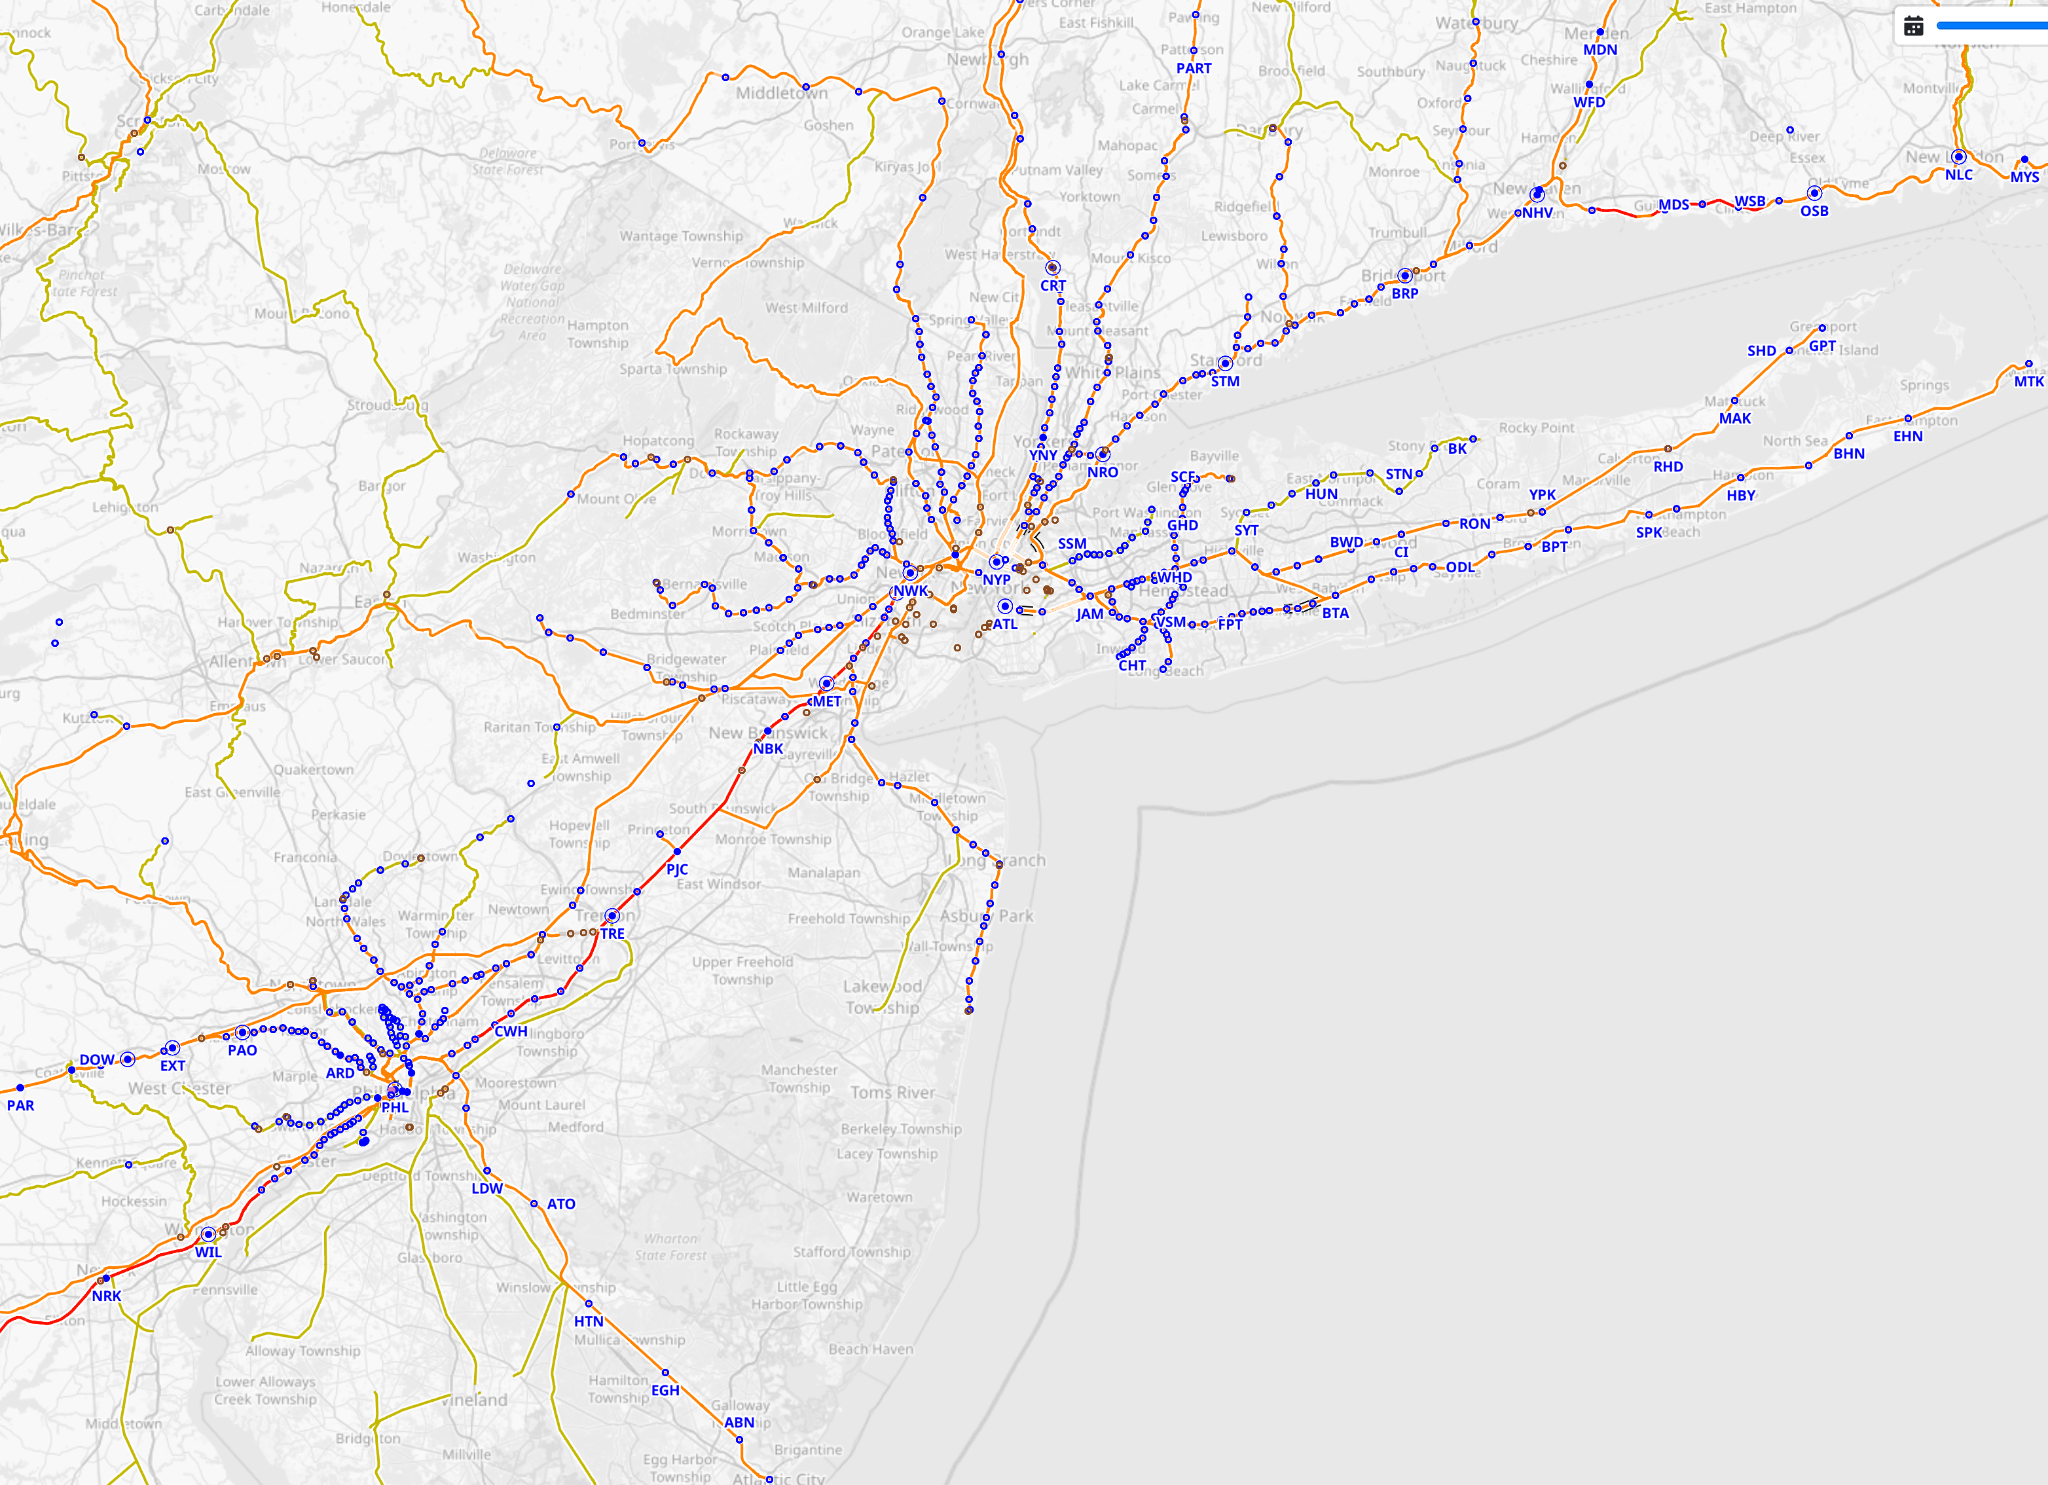
Another example is OpenRailwayMap, which uses the same OpenStreetMap data but instead highlights rail corridors and railway stations.
OpenStreetMap-based maps can be useful, but they can also just be fun. One of my favorite examples is Mascot Map, which shows schools in OpenStreetMap with icons that correspond to the mascot of the school’s sports team.
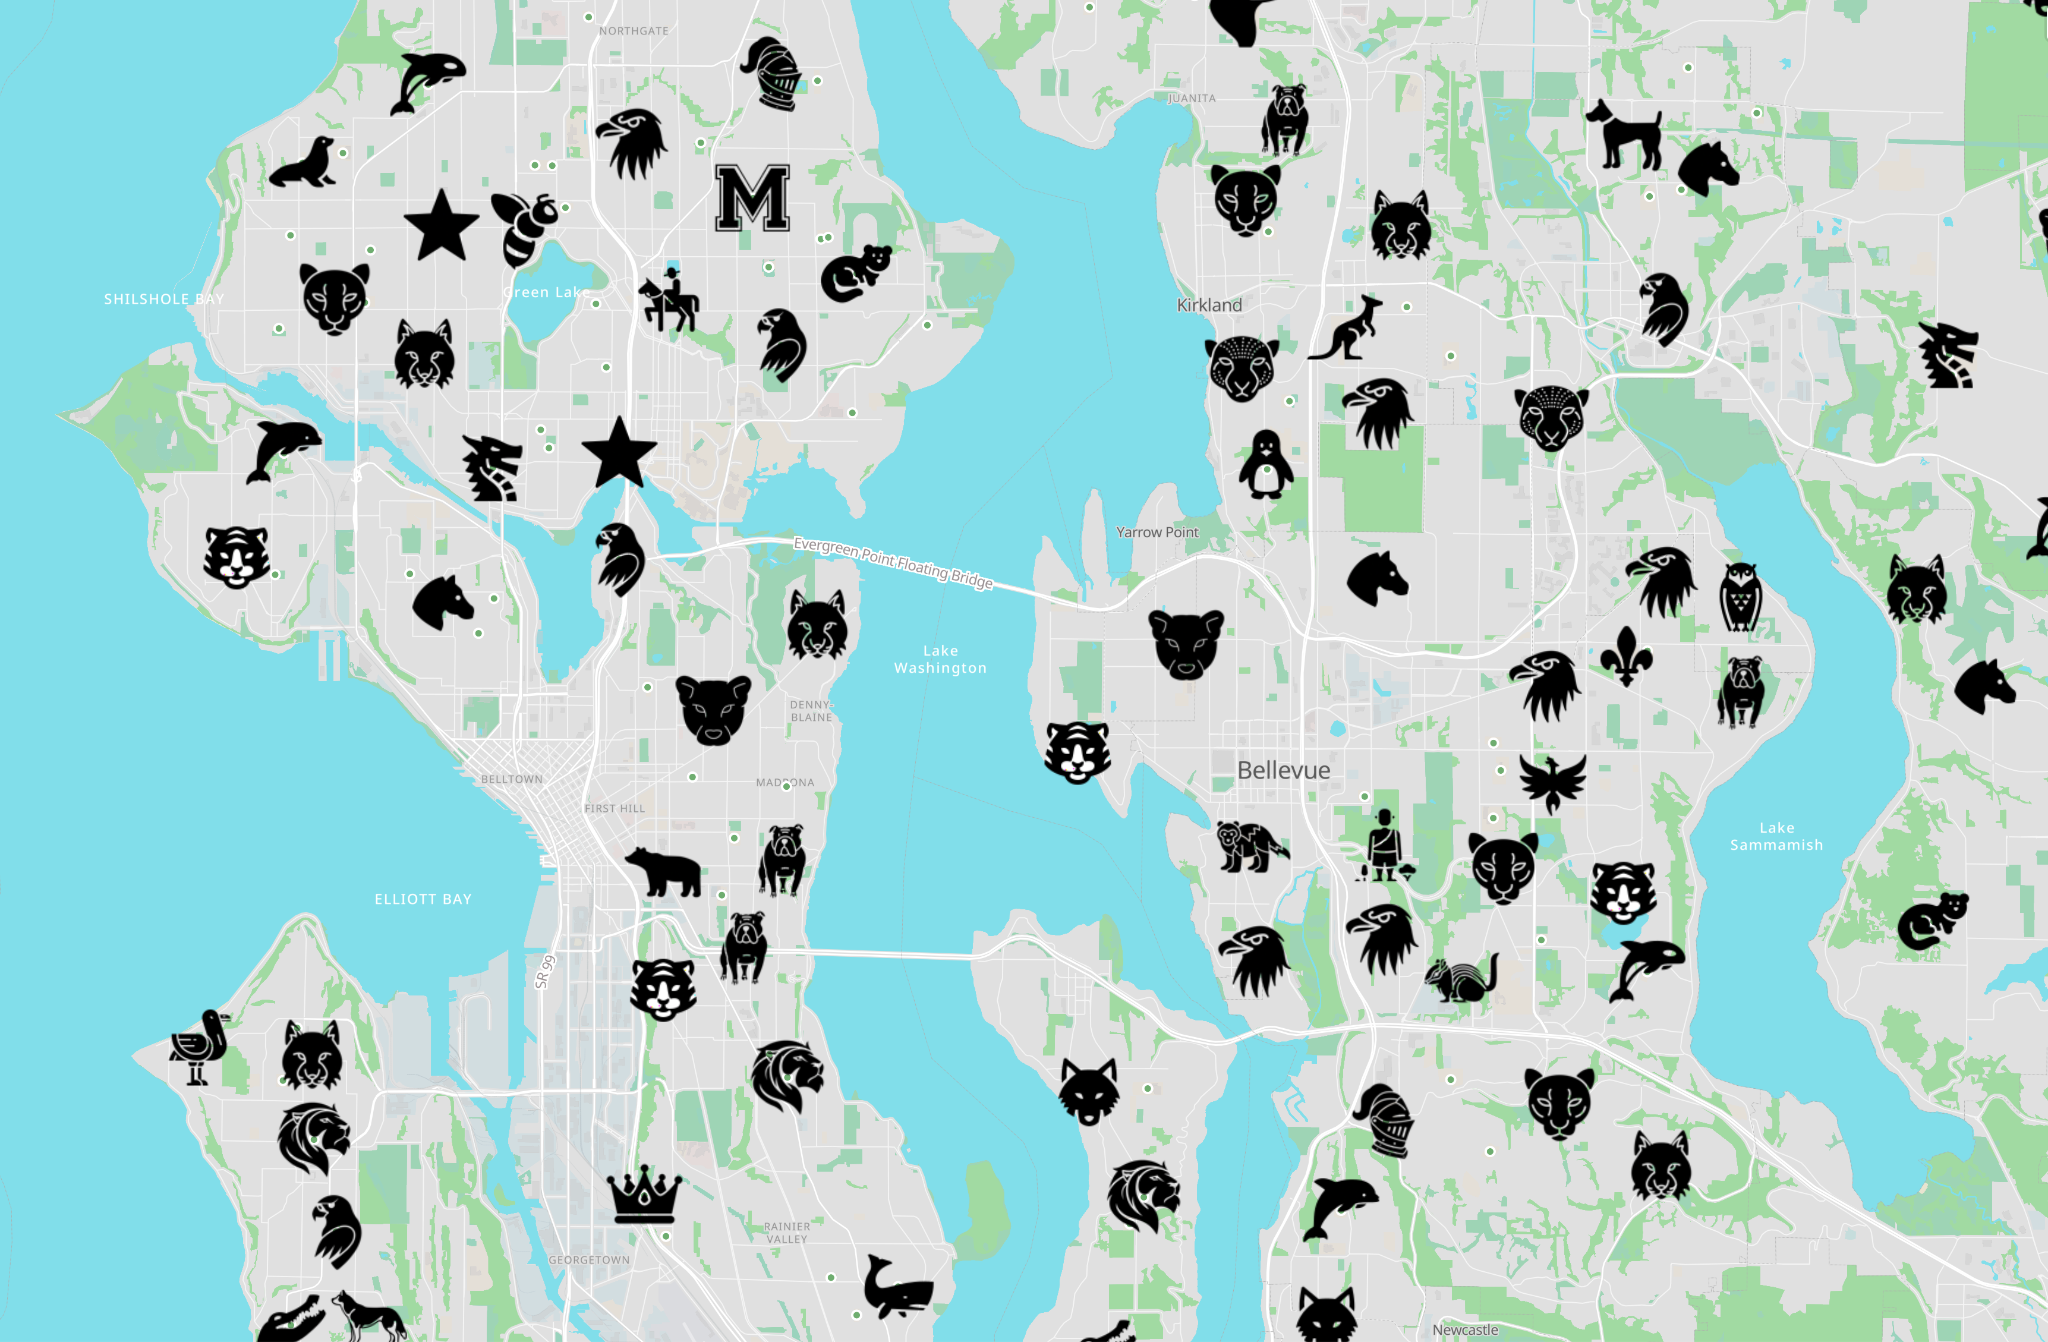
I love these kinds of maps for two reasons. The first is that they’re fun, and they show you something interesting about the world that you might not have seen before. The second is that they create a positive feedback loop within the OpenStreetMap community. OSM is maintained primarily by volunteers, who contribute to the map because it’s fun. And there’s no better way to motivate people to add missing data than to show them a cool use case for the data they’re adding.
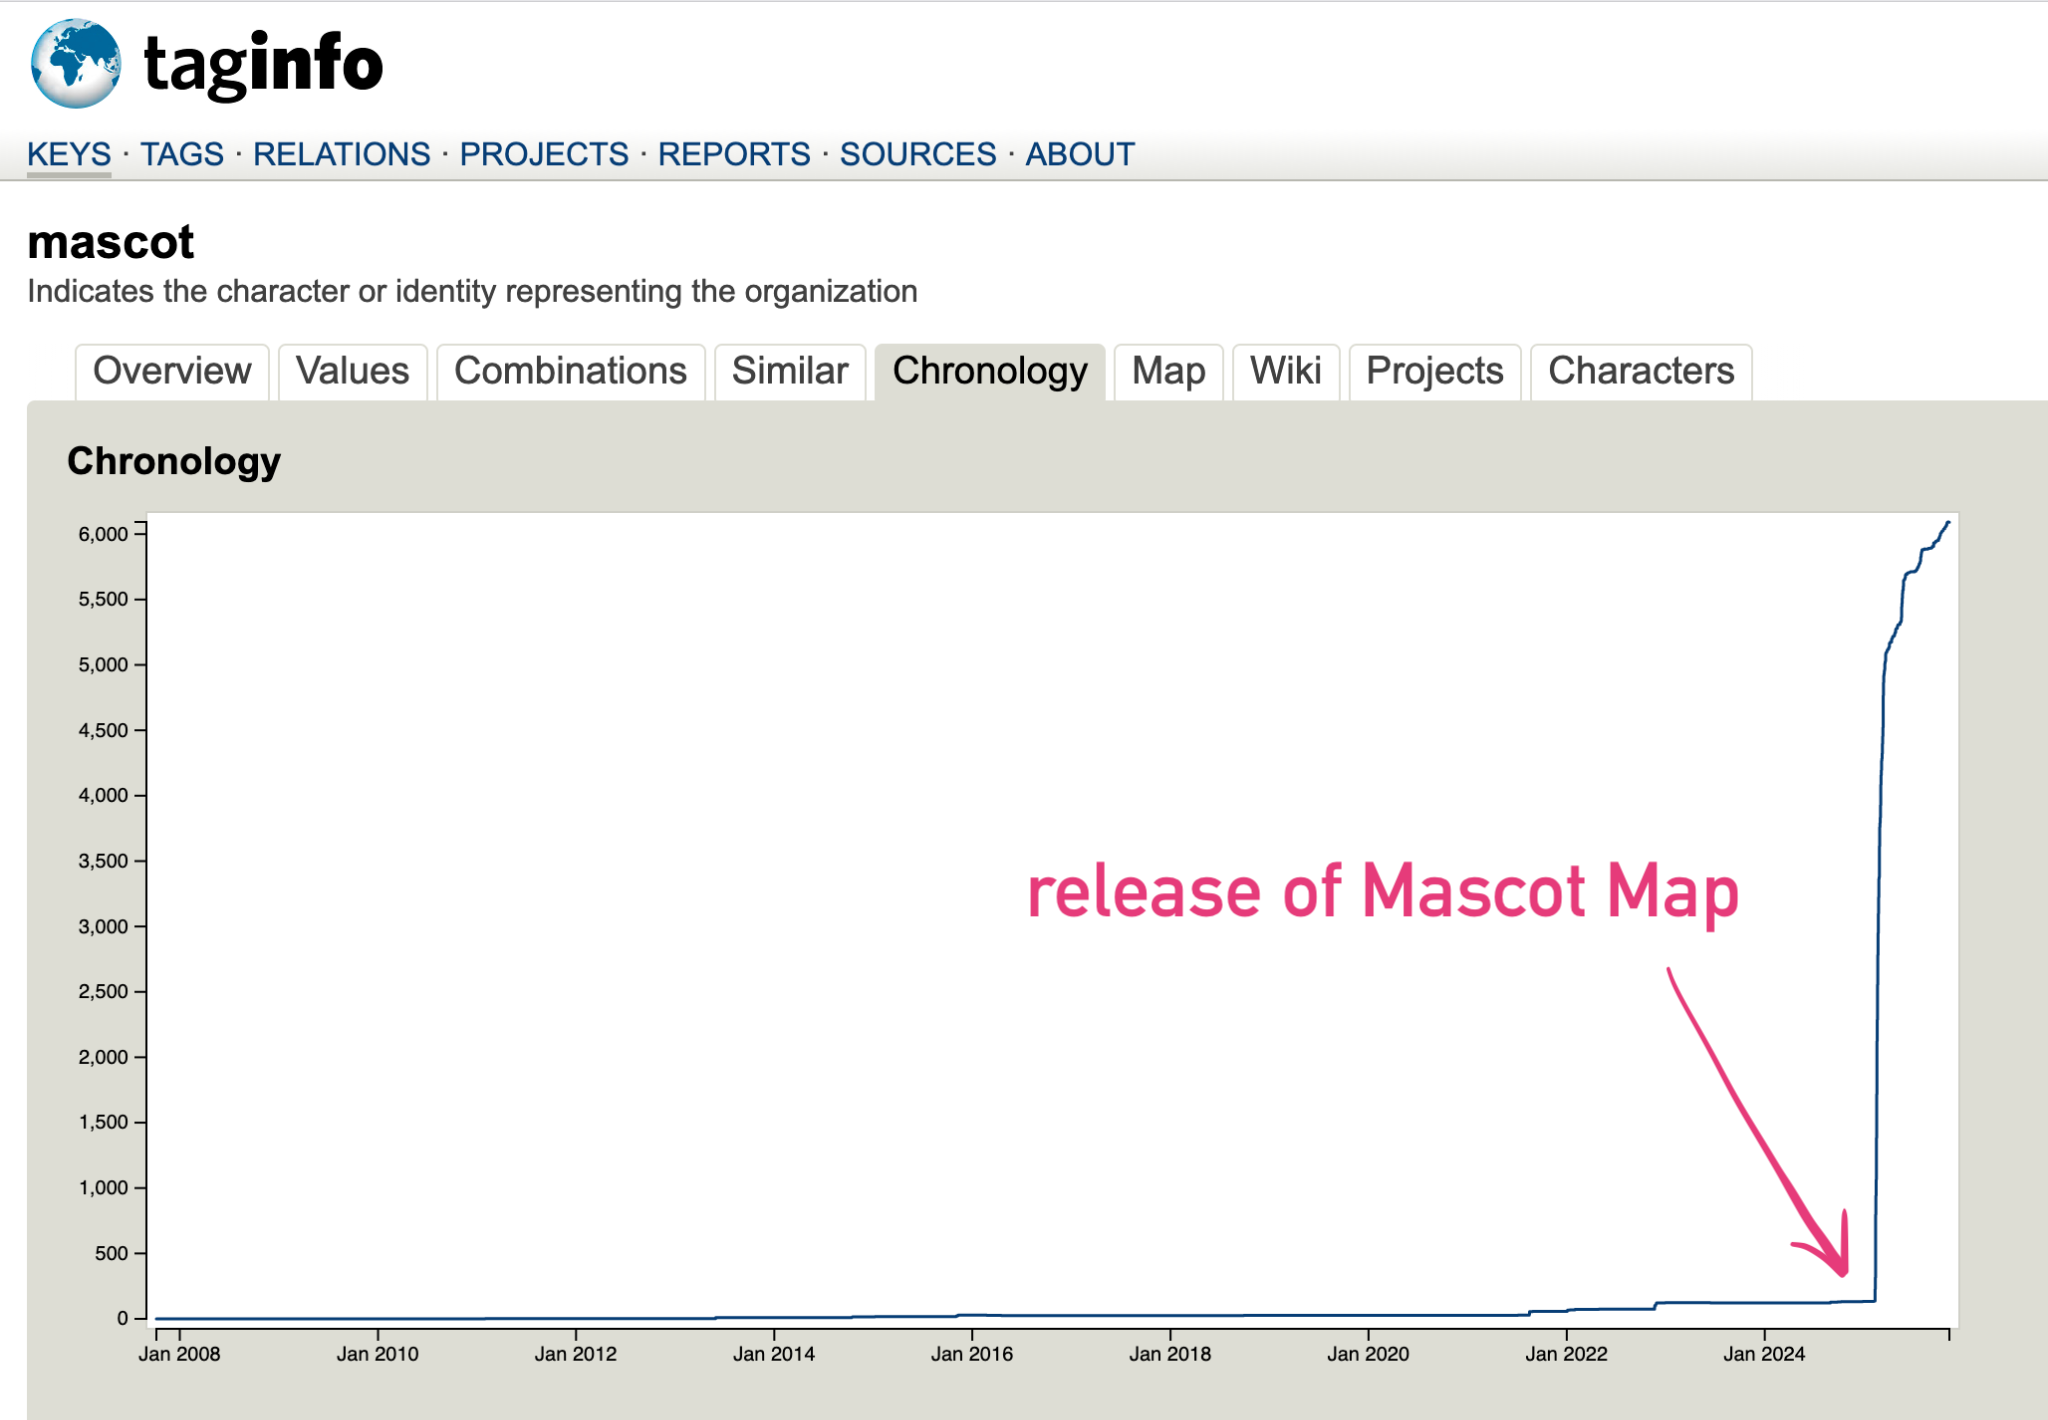
As evidence for that, have a look at the graph above, which shows the prevalence of the mascot tag in OSM (the tag you’d use to indicate a school’s mascot) over time. The tag had existed for about 15 years, but almost nobody was using it. Then Mascot Map appeared, and overnight people got excited about adding that information to thousands of schools in OSM. Now, that data is freely available for anyone else to use too.
So what is Sourdough?
Sourdough is a schema for representing OSM data in vector tile format, which is the typical data format used for creating zoomable, interactive maps on the web or in mobile apps. It’s both a specification and a reference implementation using the Planetiler framework. Sourdough’s goal is to reduce the technical barriers to making inventive, specialized maps based on OpenStreetMap data, like those shown above.
To understand what those barriers are, and how Sourdough tries to reduce them, I need to back up and talk briefly about vector tiles.
Vector tiles and tile schemas
Vector tiles exist to solve a basic problem: the world is really big, and OpenStreetMap has a lot of data about it. The OSM database is about 85 GB right now, so it would be unreasonable to make someone download the entire thing just to view a map on your website or in your app.
The solution is to cut the data into small square pieces called tiles. In the case of vector tiles specifically, each tile contains geodata (points, lines, and polygons, with associated attributes). Code running in the browser or mobile app turns this data into a visual map, by downloading just the tiles that it needs to display what’s currently in view.
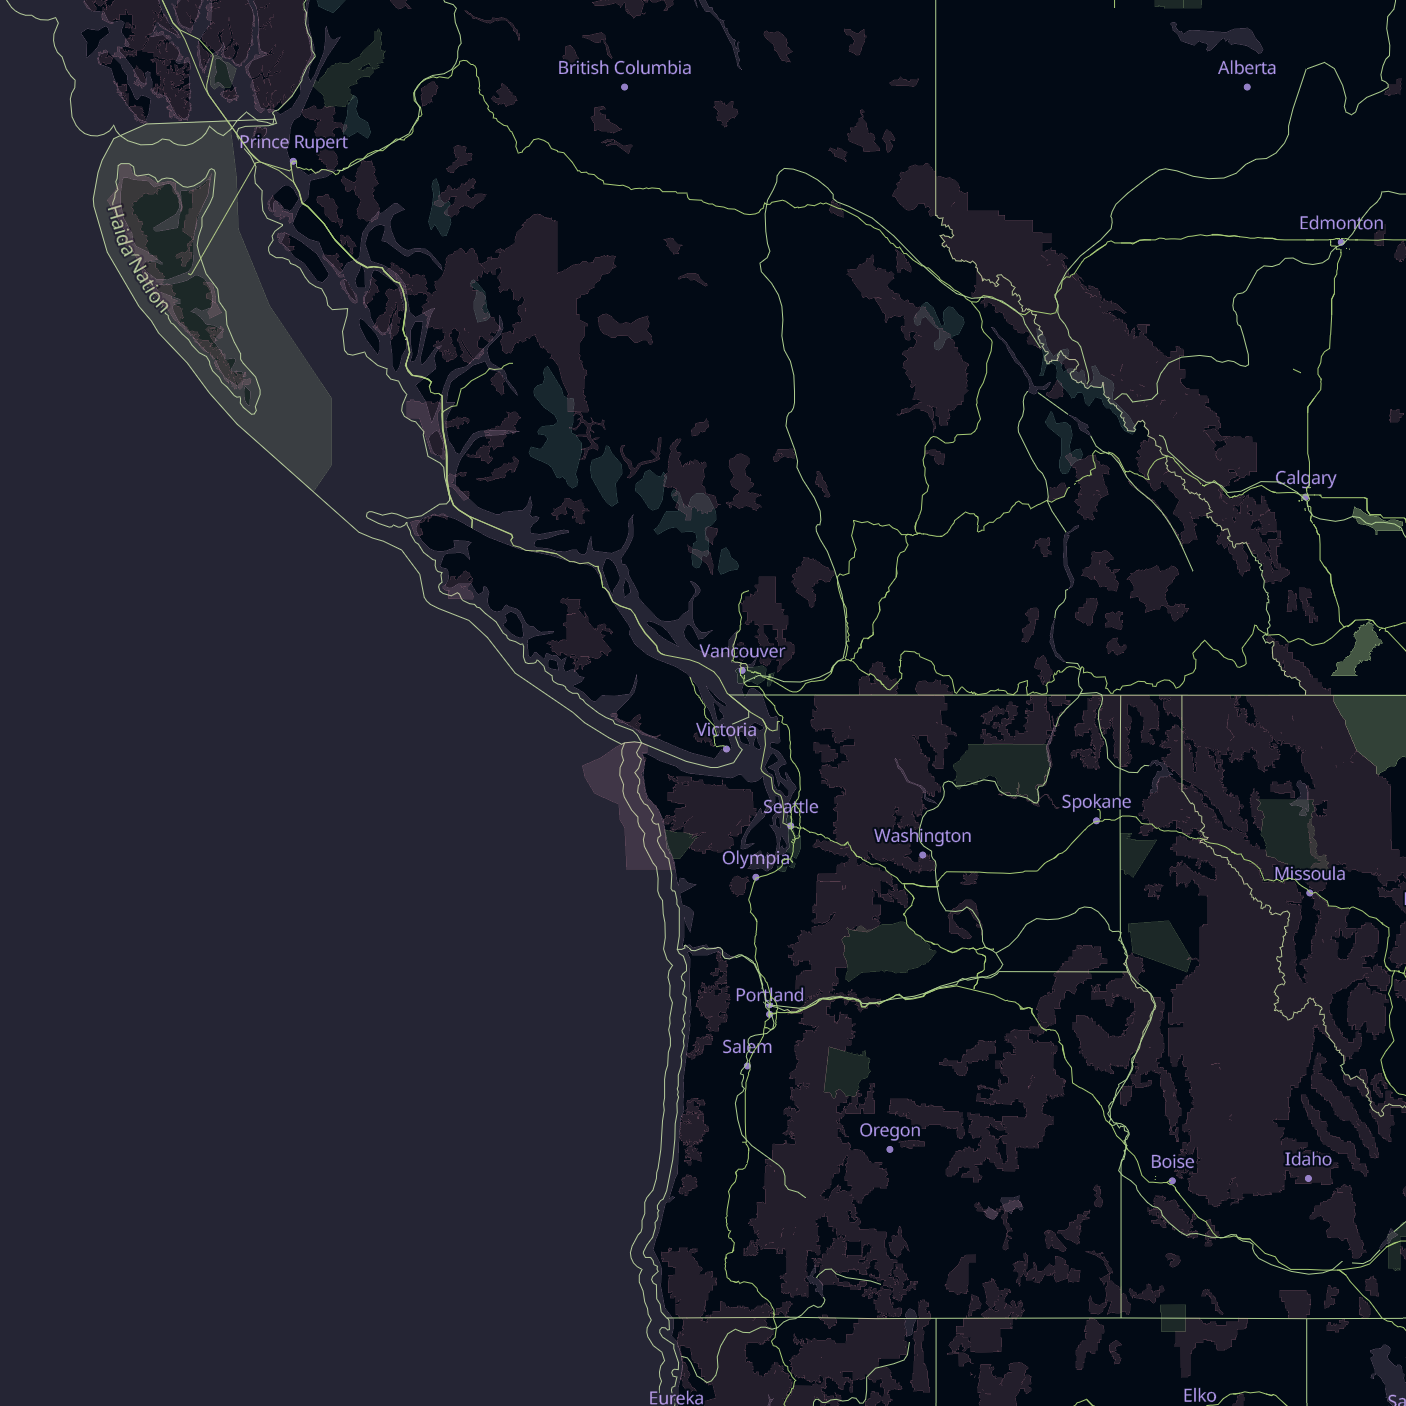
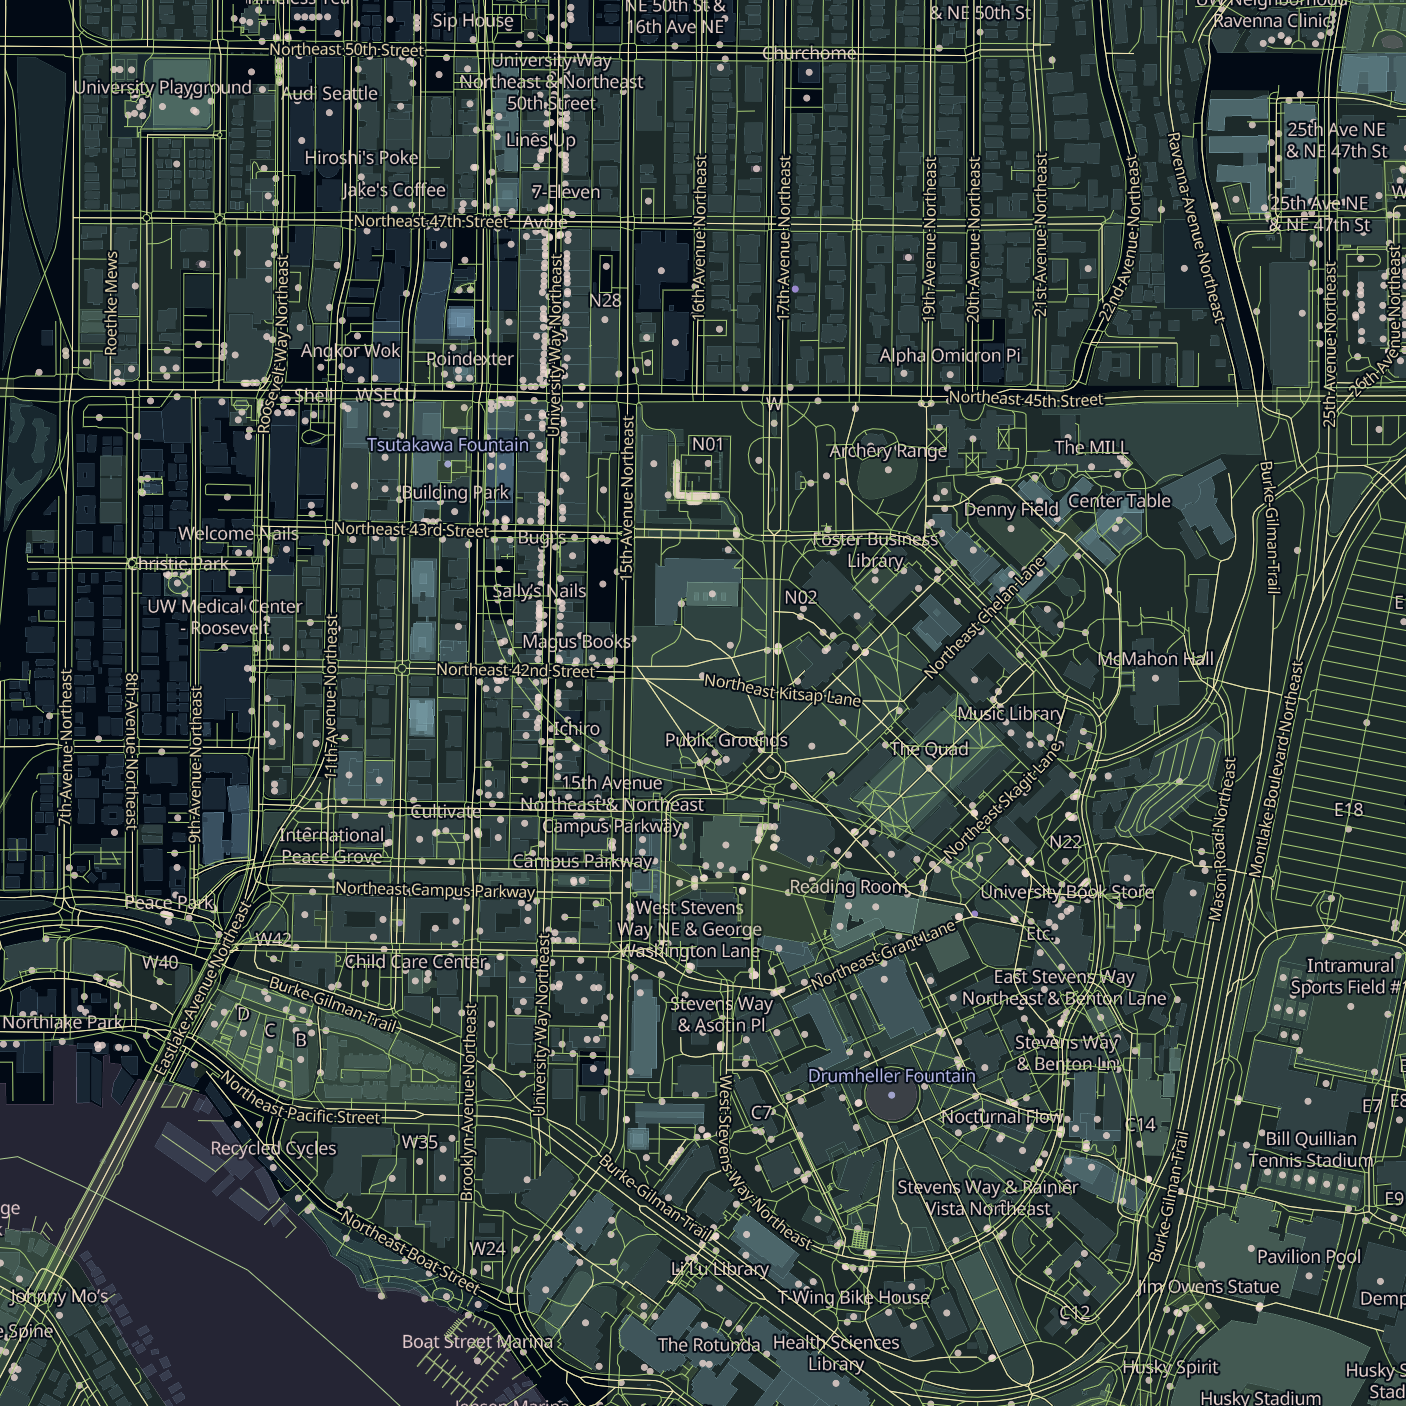
Building a tiled web map is a two-step process. The first step is taking the OSM dataset and converting it into vector tiles, which is the responsibility of the tile schema and the code that implements it. The tileset needs to contain tiles for many different zoom levels: high-zoom tiles that contain a lot of detail about a small area for when you zoom in close, and low-zoom tiles that show a generalized view for when you zoom out.
The second step is applying a stylesheet to the data, which is similar to a CSS stylesheet if you’re a web developer. The stylesheet dictates the appearance of the data on the map: what color to use for the water, how thick the lines should be for different kinds of roads, what font to use for text labels, and so on.
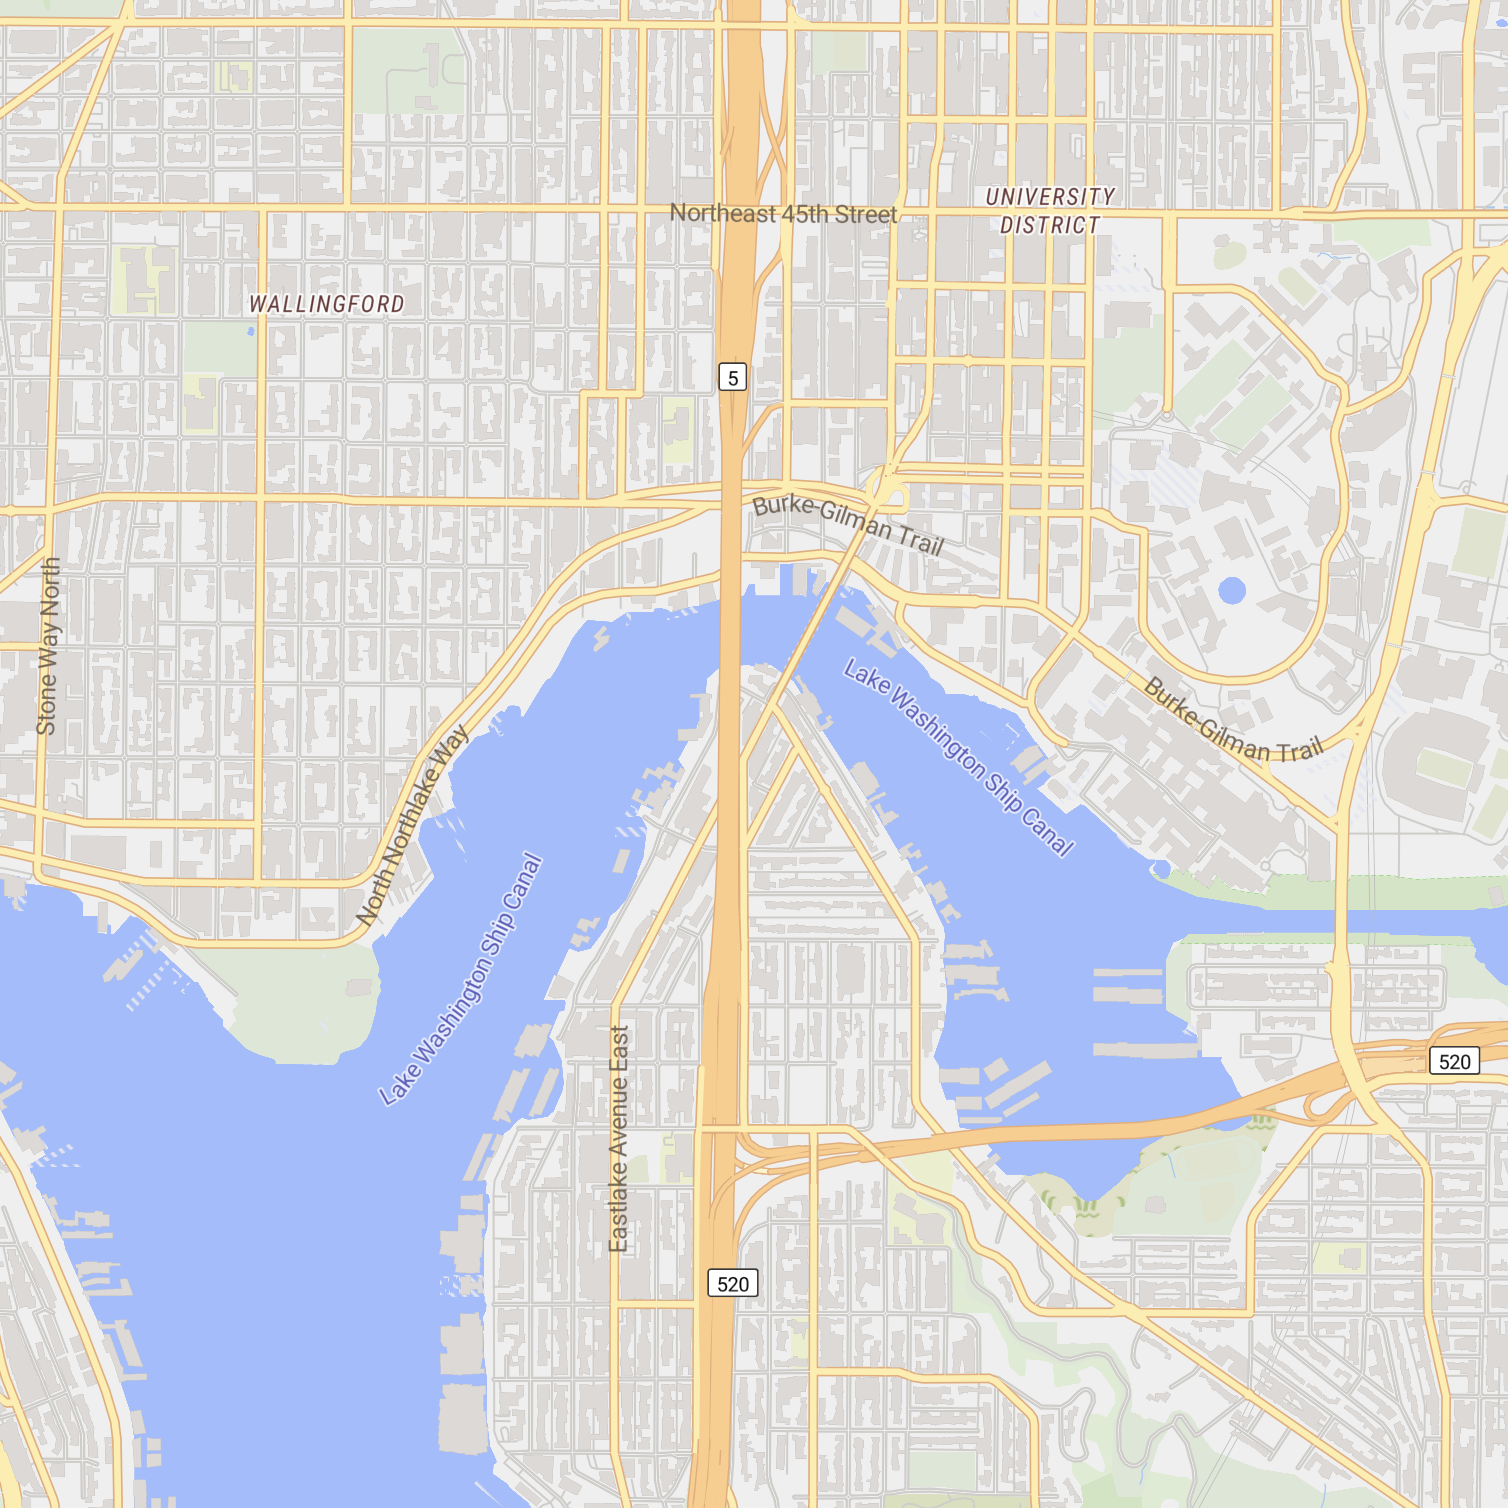
Something to notice is that cartography is happening at both of these steps, not just the second one. The stylesheet controls how things look, but the schema controls what’s even available to look at. It’s easy to modify a stylesheet to tweak colors or fonts, but a stylesheet can only render the data that is present in the tiles. So in practice, the tile schema is what determines the range of maps that can be built on top of a given tileset.
Existing schemas
There are two open source vector tile schemas that already exist for OpenStreetMap: OpenMapTiles and Shortbread. Both are great projects: they are mature, well documented, and each have several open source stylesheets built on top of them that you can use as a starting point for your own maps.
So why would I build Sourdough if these already existed? Well, something I noticed about these two schemas is that they make a lot of the same design decisions. They are both optimizing for small tile sizes, and they do so by including only the data necessary for general-purpose maps—roads, buildings, POIs, basic landcover—and leaving out a lot of other stuff. Along the way, they also reorganize and simplify OSM’s tagging system, in order to clean up the data and make things easier for someone writing a stylesheet.
These are reasonable decisions to make. But designing a tile schema is a game of trade-offs, and a consequence of these choices is that you can’t use OpenMapTiles or Shortbread to build the kinds of maps I showed earlier, because the necessary data simply isn’t included in the tiles. A stylesheet can’t render what’s not there.
Even on features that they do include, these schemas only contain a small set of common attributes (road names, POI types, etc). You can’t use these schemas to make a map that differentiates state parks from national parks, or saltwater from freshwater, or restaurants serving vegetarian food from those that don’t, because those attributes get dropped during tile generation even when the information is present in OSM.
What if we did the opposite?
Sourdough is an experiment in taking the opposite trade-offs.
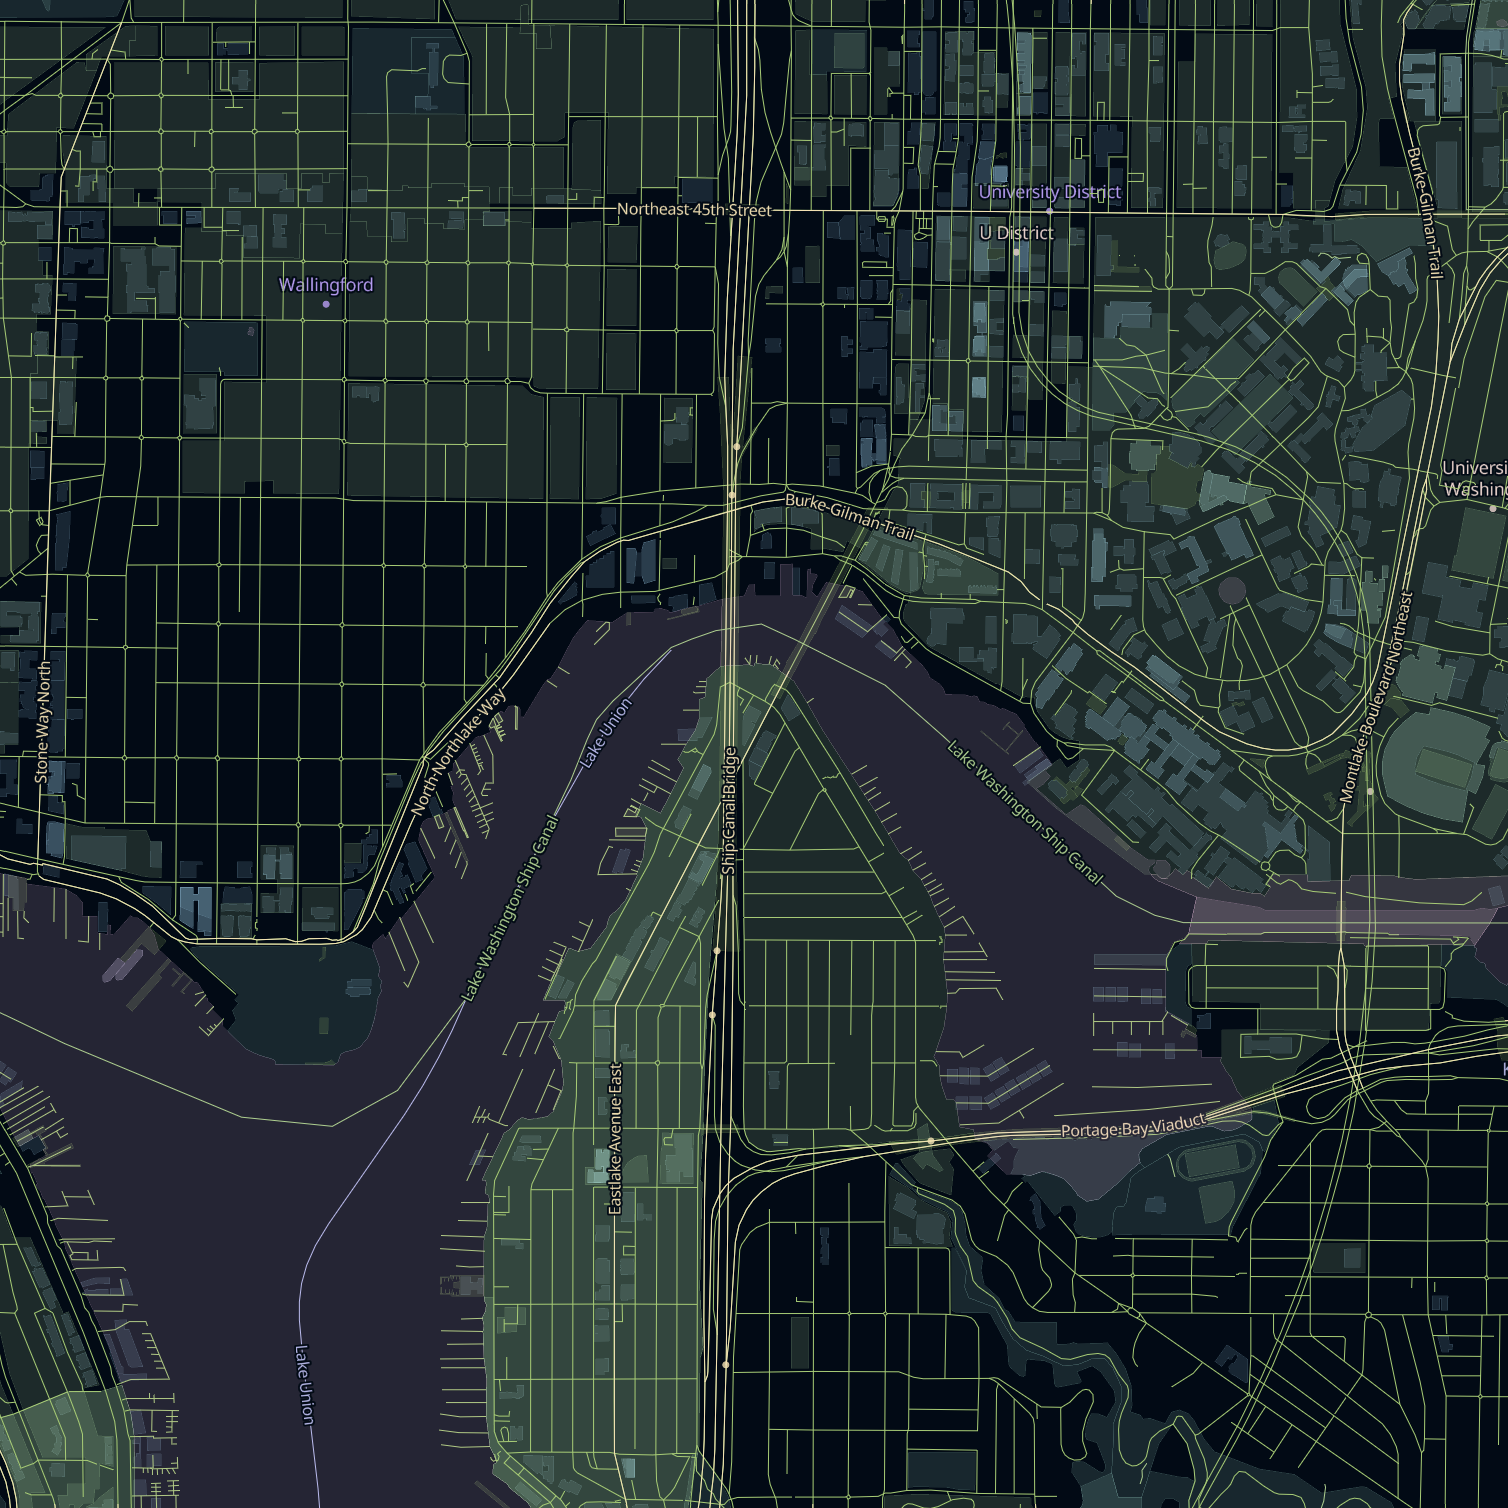
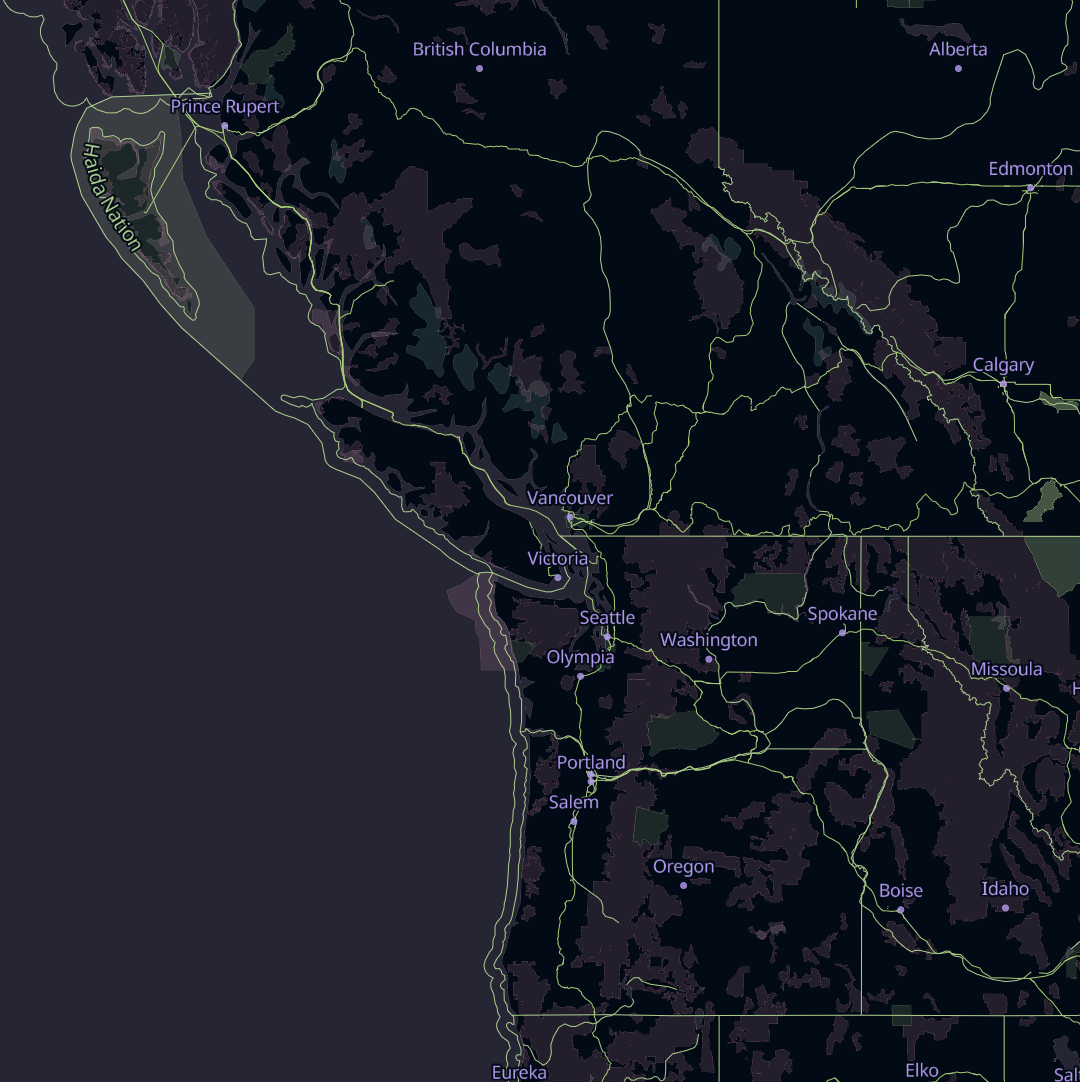
Instead of optimizing for small tile sizes, Sourdough tries to put as much data into the tiles as possible (right up to the breaking point where you can no longer get reasonable performance from your maps). And instead of simplifying and abstracting the OSM data model, Sourdough presents it directly, exposing both its nuance and its rough edges.
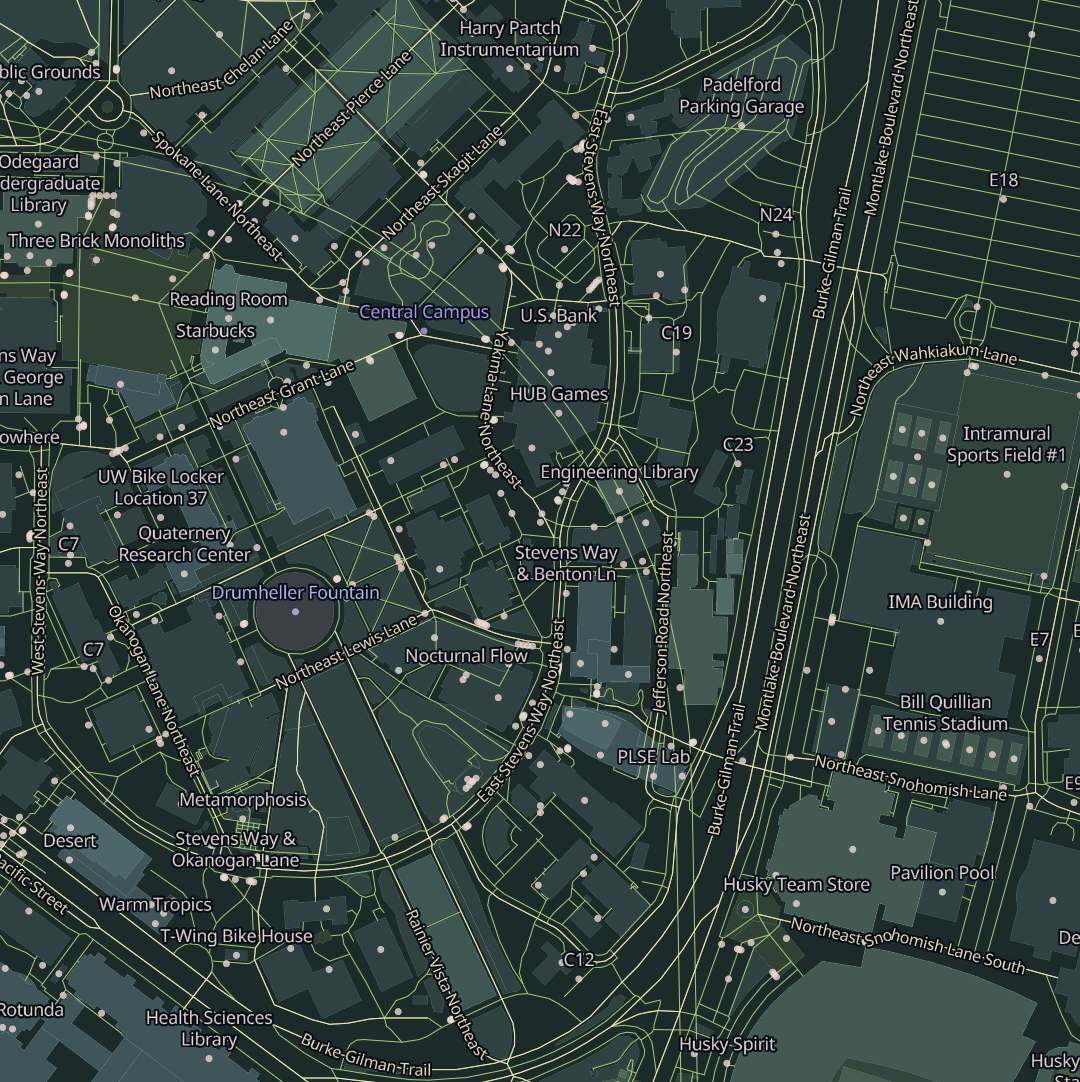
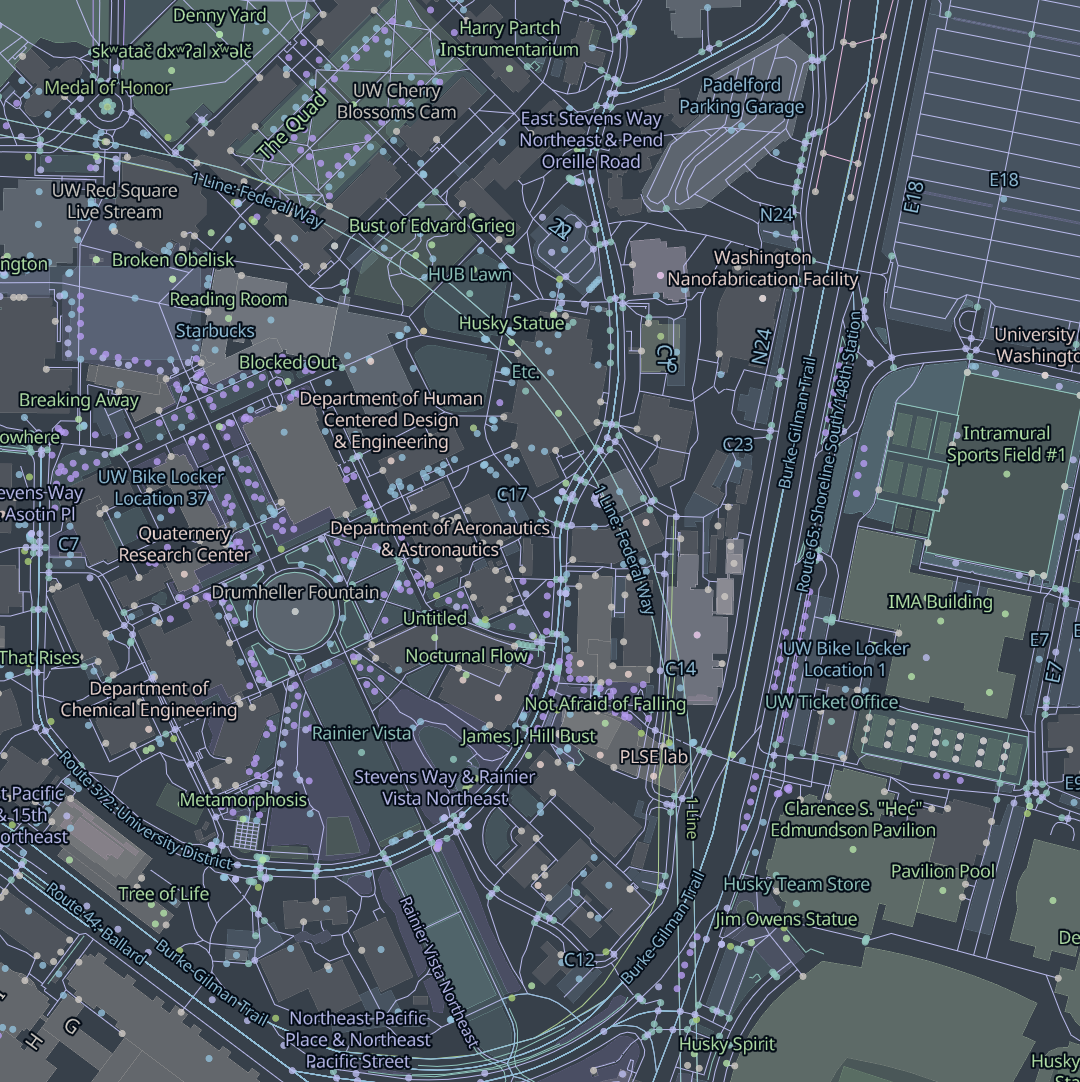
Sourdough tiles are packed with data. At zoom 15, which corresponds to the scale of a few city blocks, the tiles include nearly everything that’s in OpenStreetMap. That’s more than you’d ever want to responsibly display at once, but the point is that it gives the stylesheet author choices about what to show.
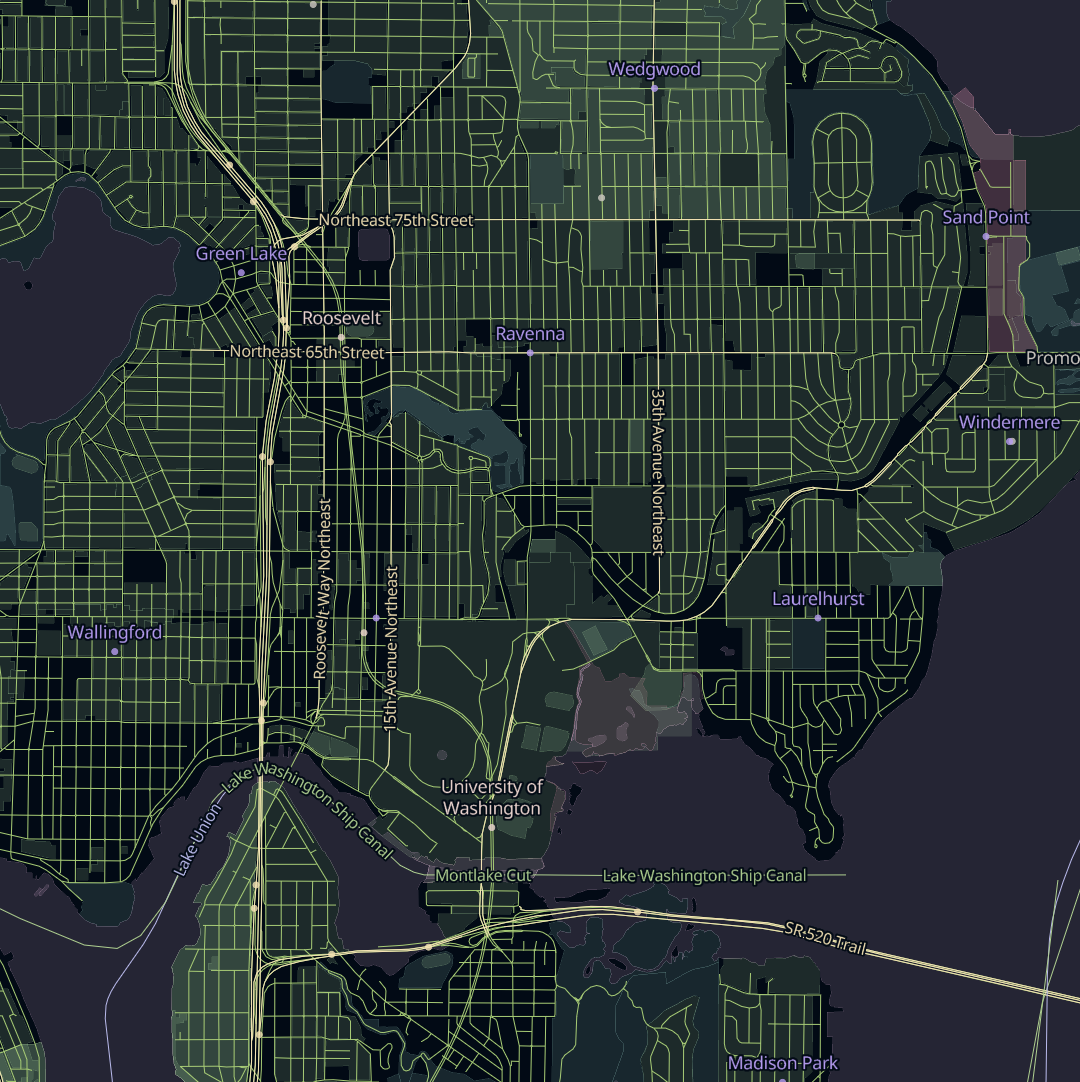
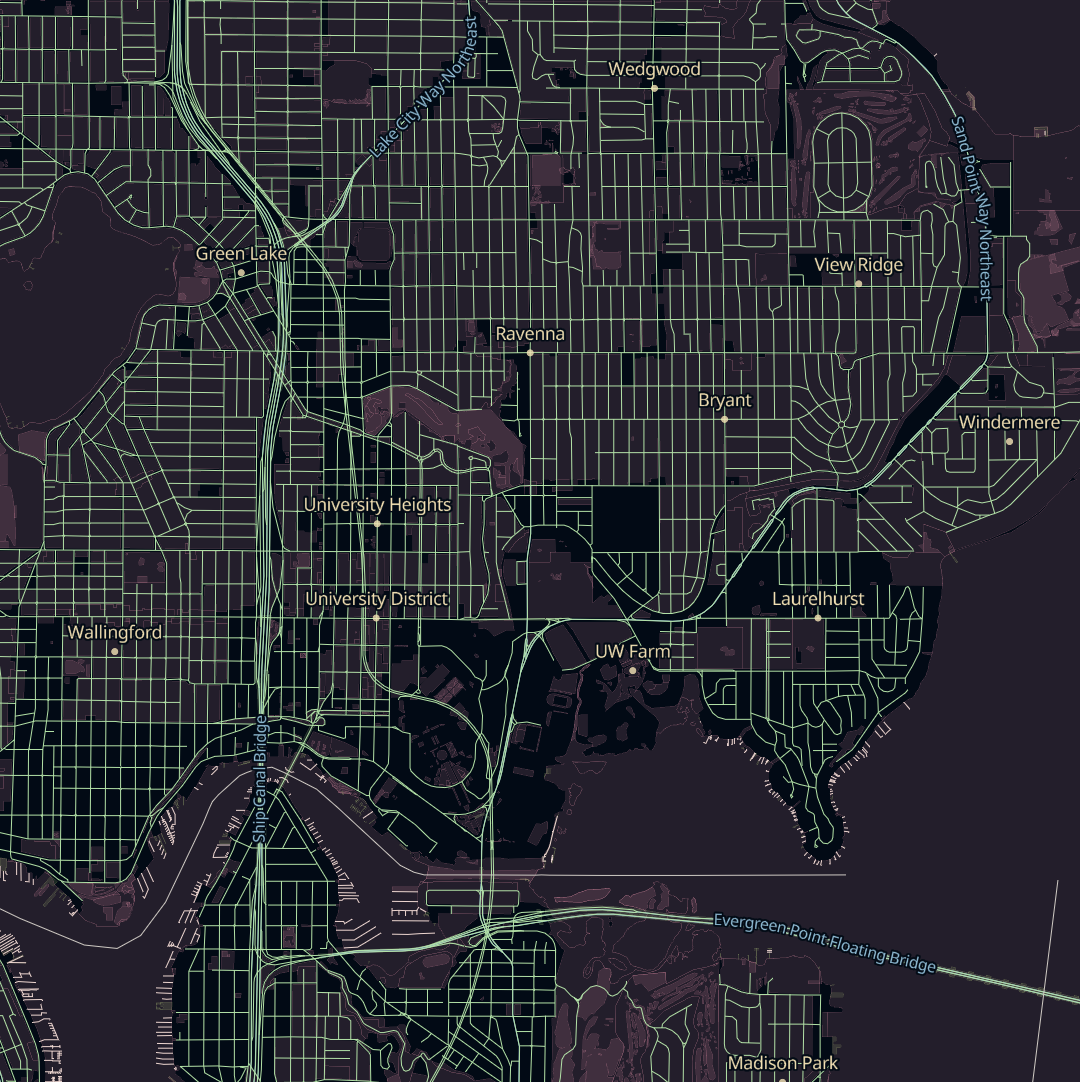
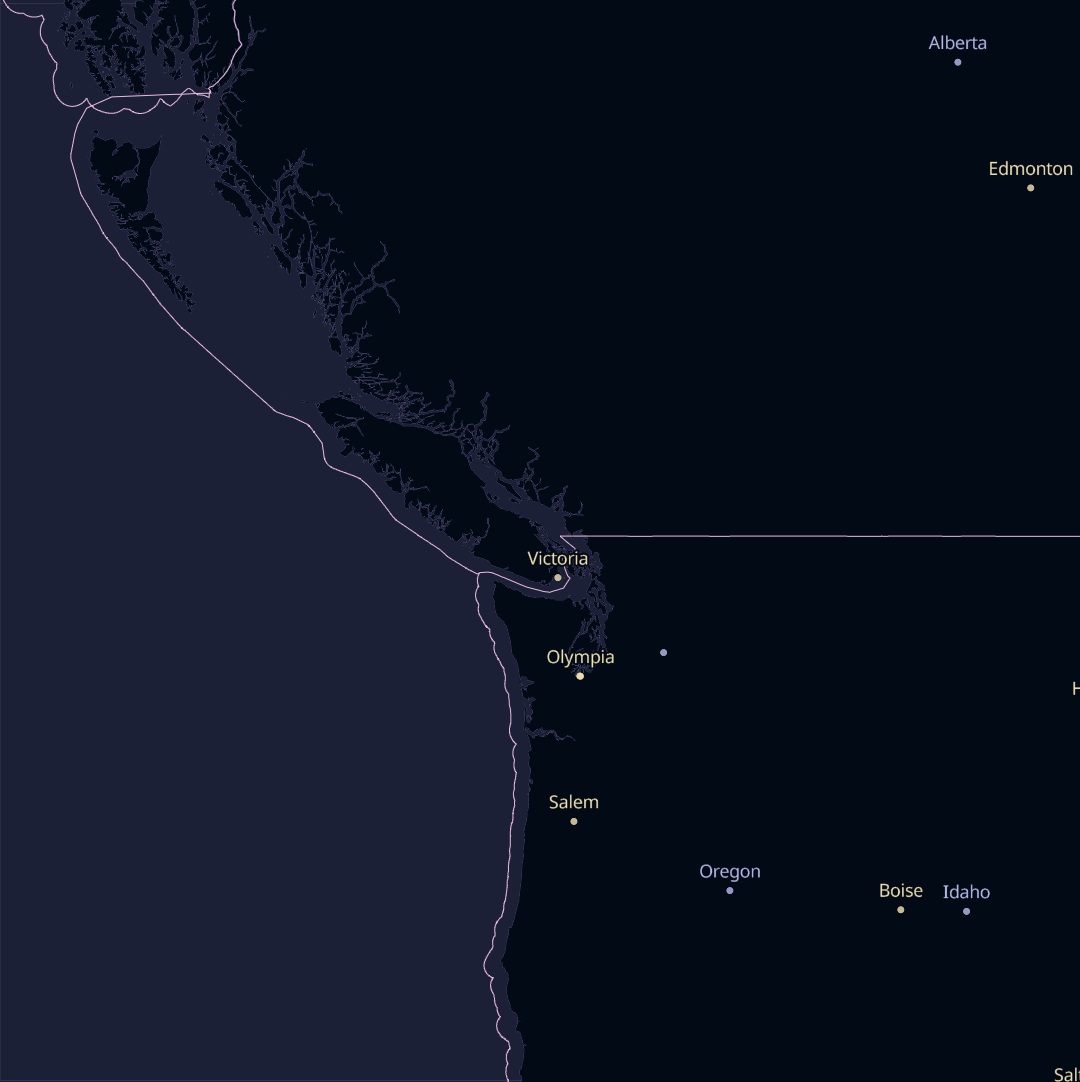
Sourdough also takes a generous approach to pruning features at lower zooms. Existing schemas tend to approach this by asking “what’s the bare minimum data we need at zoom 6 to satisfy the most common cartographic use cases?” Sourdough flips that around and asks “how much stuff can we fit in a tile at zoom 6 without exceeding our tile size budget?” My aim was to keep 99% of tiles under 100 KB.
When it comes to organizing OSM data into vector tiles, Sourdough takes a minimalist approach, and exposes OSM’s data model as directly as possible.
OpenStreetMap has a concept of top-level tags, which are categories that most things in OSM fall into. Sourdough exposes each top-level tag as a tile layer, so there are layers for buildings, amenities, highways, landuse, power, railways, waterways, and so on.
Within each layer, features carry attributes that map one-to-one with the OSM tags relevant to that kind of feature. So features in the buildings layer have attributes like building, building:levels, building:material, height, roof:material, and name. Each of these is just the name of an OSM tag that’s likely to be relevant to buildings.
This is useful for two reasons. The first is that it gives cartographers a lot to work with: you can visualize buildings based on many different properties if you want to make those cartographic choices in your map. The second is that Sourdough doesn’t have to invent and document its own model of how to describe things in the physical world. It can just forward the decisions made by the OpenStreetMap community and use their documentation. If you’re wondering what the possible values for Sourdough’s roof:material attribute are, you go to the OpenStreetMap wiki and look up the roof:material tag.
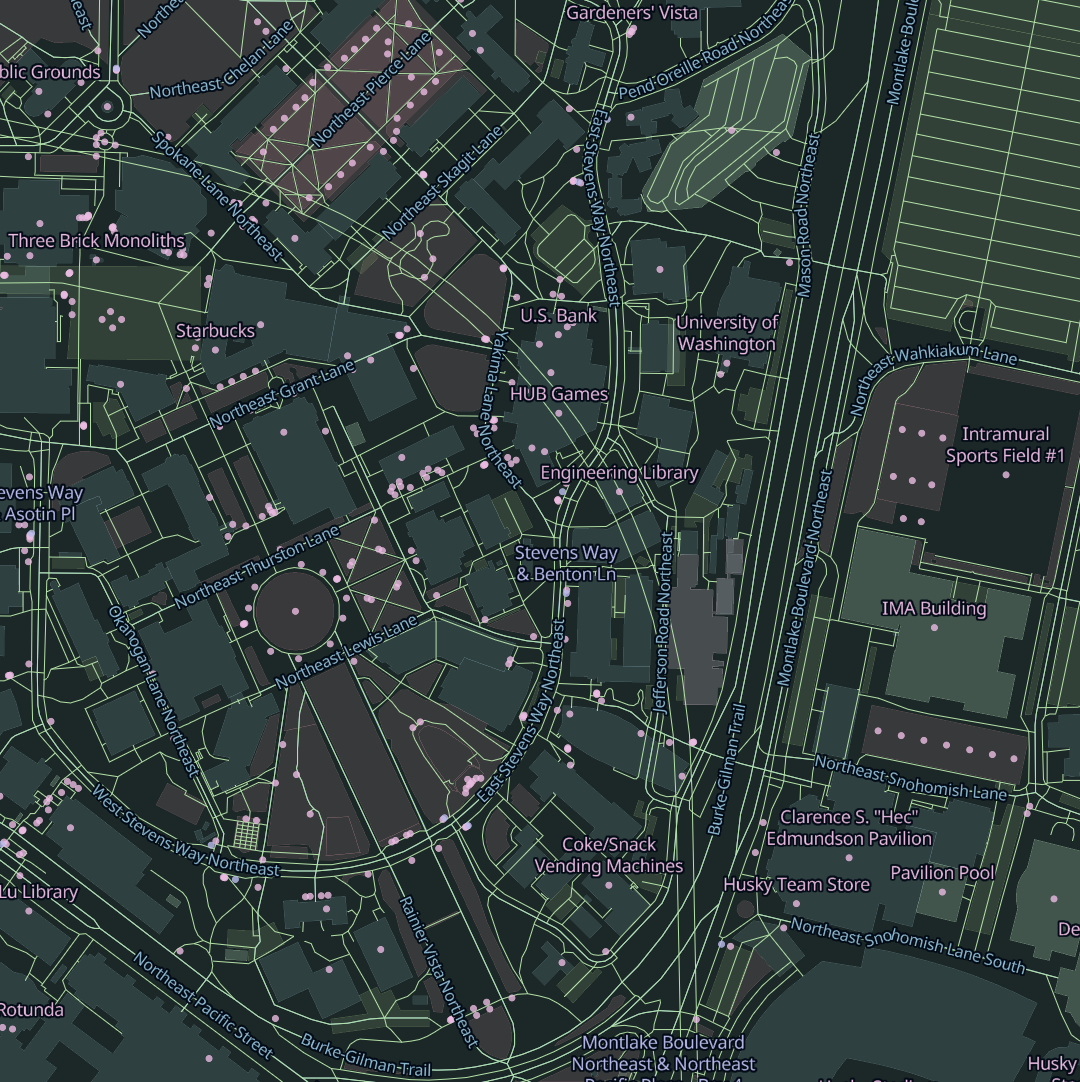
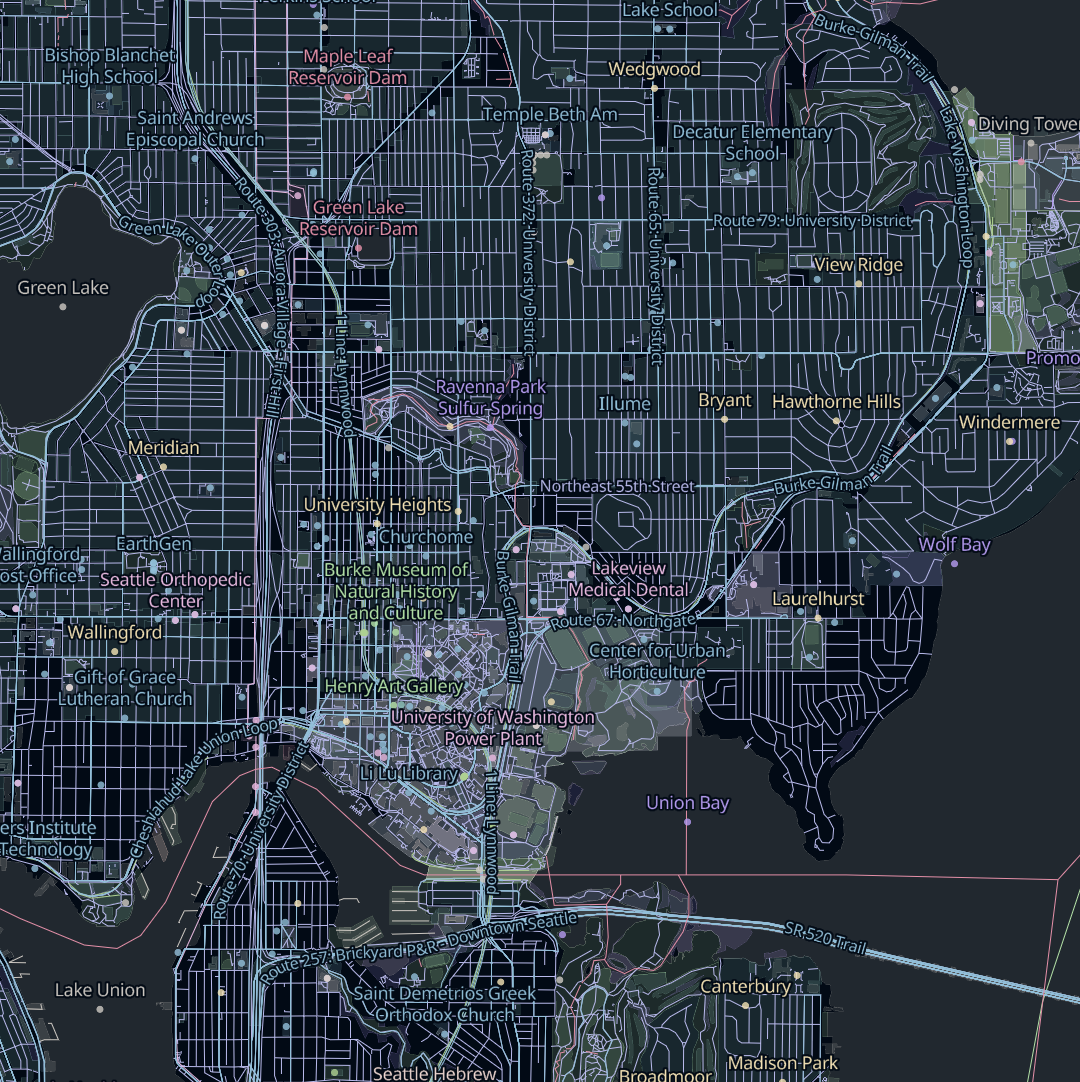
Some layers have a lot of attributes. The amenities layer, which covers things like restaurants, bars, and cafes, exposes over 60, including everything from bicycle_parking to diet:halal to outdoor_seating to takeaway. When an attribute isn’t present on a given feature, it doesn’t take up any space in the tile data (null values are essentially free). But by including these attributes when they are present, it means cartographers can choose to style features differently based on these tags, or highlight certain features while filtering out others.
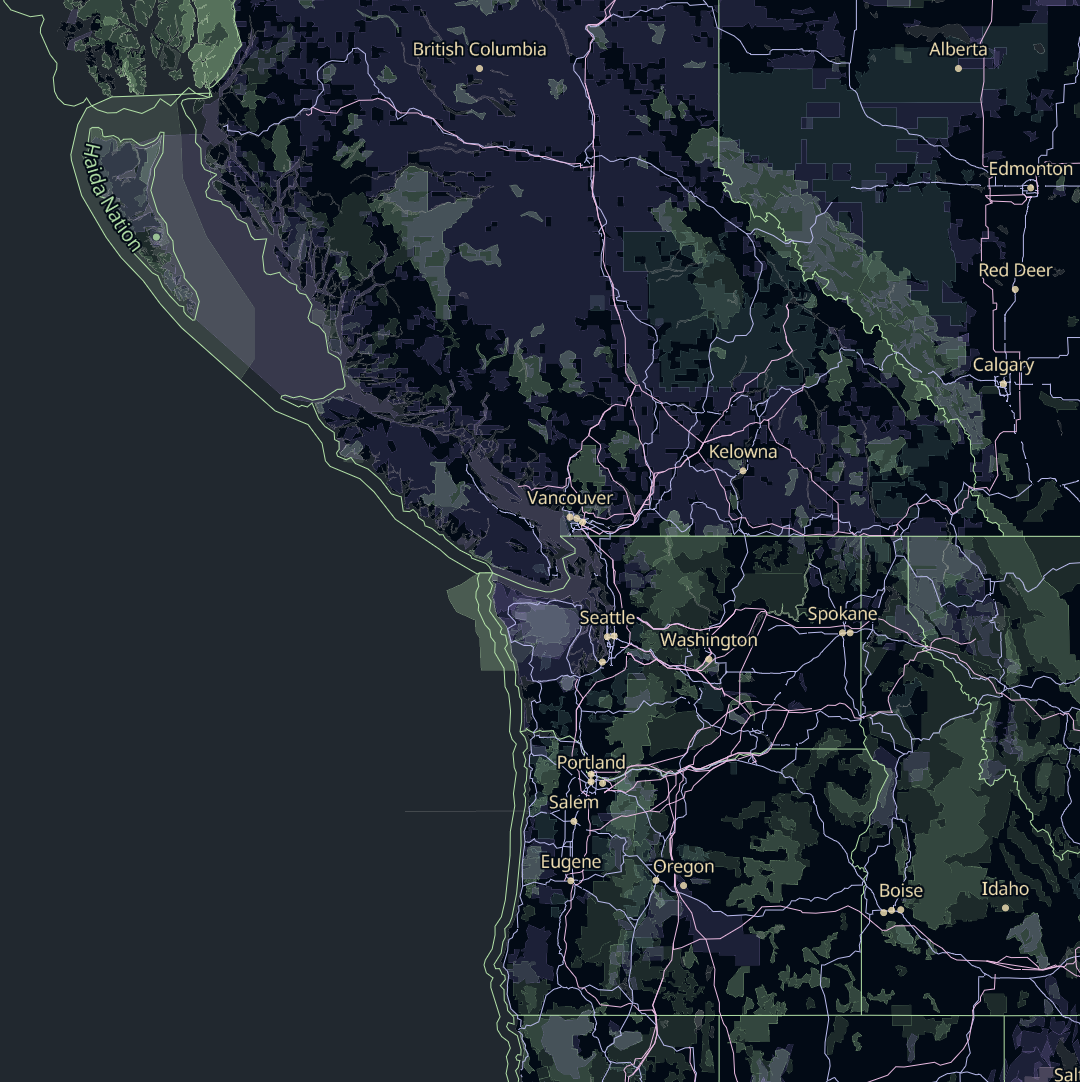
The result is that Sourdough tiles are larger than what you’d get from other schemas, but they afford a lot of flexibility in what you choose to display.
Sourdough’s goals
Sourdough is designed around a few specific goals:
- Be easy to understand. It tries not to create new abstractions where they aren’t needed, and just presents OpenStreetMap data directly.
- Support cartographic experimentation. By including as much data from OSM in the tiles as possible, Sourdough makes it easier to create diverse and specialized maps that highlight all the different types of data in OpenStreetMap.
- Showcase OSM’s taxonomy, and help improve it. Sourdough’s direct representation of OSM’s taxonomy highlights both its strengths and its quirks, which I hope will create a feedback loop to help community efforts to make OSM data more consistent and useful for data consumers.
- Be a hackable starting point for custom tiles. If you prototype a map with Sourdough, but then realize you’ve outgrown the schema and need to optimize or modify it, Sourdough’s code is designed to be easy to fork and modify.
But as I said earlier, designing a tile schema is a game of trade-offs, and Sourdough’s design decisions come with some drawbacks too:
- Because Sourdough tiles are meant to be flexible for many different types of maps, they contain a lot of data, which can make your map load more slowly than if you’d used a different schema.
- Since Sourdough aims to be a simple and direct representation of OSM data, it leaves it to map-makers to handle synonymous tags, troll tags, and other idiosyncracies in OSM’s data model.
Roadmap
Sourdough is still in an early, experimental phase. I’m currently working on refining the schema and implementation, solving some edge cases and tricky design decisions (especially around how to represent OSM relations in ways that are useful to map makers).
Later this year I hope to release a v1.0 version of the schema, after which future 1.x versions will be backwards compatible.
I’ve opened some issues on GitHub describing problems that still need solving in the schema, which I hope to sort out before releasing v1.0. If you have thoughts on any of them, I’d love to hear them.
Try it out
While Sourdough is still evolving, it is ready to play around with today.
You can learn more about the tiles on the website: sourdough.osm.fyi. There you will find an interactive data viewer that lets you explore the tileset and get a feel for what data is included. There’s also complete documentation of the schema, and some example stylesheets that showcase what kinds of maps are possible with Sourdough (which you can edit and extend using the Maputnik stylesheet editor).
Sourdough’s schema, codebase, and examples are all available under the CC0 license and are in the public domain. You can do whatever you want with them, and don’t need to ask permission or give credit.
OpenStreetMap itself is available under the ODbL license, which requires that you attribute OpenStreetMap when you use the data to make maps. So if you create a map using Sourdough tiles, please remember to display “Map data from OpenStreetMap” or similar on or near your map, with a link to the OpenStreetMap project. See OpenStreetMap’s attribution guidelines for details.
If you try Sourdough and use it to make a map, I’d love to hear your thoughts on it. The point of the project is to make interesting, novel and weird maps easier to build; I hope you will be inspired to try it out and make something cool.